Learning Scientific Programming with Python (2nd edition)
E7.27: Depicting a helix
Below is a simple example of a three-dimensional plot of a helix, which could represent circularly-polarized light, for example.
import numpy as np
import matplotlib.pyplot as plt
from mpl_toolkits.mplot3d import Axes3D

n = 1000
fig, ax = plt.subplots(subplot_kw={"projection": "3d"})

# Plot a helix along the x-axis
theta_max = 8 * np.pi
theta = np.linspace(0, theta_max, n)
x = theta
z = np.sin(theta)
y = np.cos(theta)
ax.plot(x, y, z, "b", lw=2)

# An line through the centre of the helix
ax.plot((-theta_max * 0.2, theta_max * 1.2), (0, 0), (0, 0), color="k", lw=2)
# sin/cos components of the helix (e.g. electric and magnetic field
# components of a circularly-polarized electromagnetic wave
ax.plot(x, y, 0, color="r", lw=1, alpha=0.5)
ax.plot(x, [0] * n, z, color="m", lw=1, alpha=0.5)

# Remove axis planes, ticks and labels
ax.set_axis_off()
plt.show()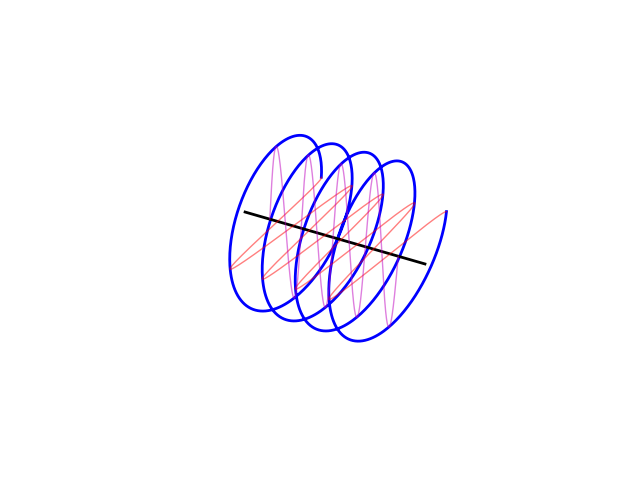
A helix.