Learning Scientific Programming with Python (2nd edition)
E7.17: BMI data with confidence ellipses
The following code reads in the heights and masses of 260 women and 247 men from the data set published by Heinz et al., Journal of Statistical Education 11 (2), 2003, and available as body.dat.txt. It plots the (height, mass) pairs for each individual on a scatter plot and, for each sex, draws a $3\sigma$ covariance ellipse around the mean point. The dimensions of this ellipse are given by the (scaled) eigenvalues of the covariance matrix and it is rotated such that its semi-major axis lies along the largest eigenvector.
import numpy as np
import matplotlib.pyplot as plt
from matplotlib.patches import Ellipse

FEMALE, MALE = 0, 1
dt = np.dtype([("mass", "f8"), ("height", "f8"), ("gender", "i2")])
data = np.loadtxt("body.dat.txt", usecols=(22, 23, 24), dtype=dt)

fig, ax = plt.subplots()


def get_cov_ellipse(cov, centre, nstd, **kwargs):
    """
    Return a matplotlib Ellipse patch representing the covariance matrix
    cov centred at centre and scaled by the factor nstd.

    """

    # Find and sort eigenvalues and eigenvectors into descending order
    eigvals, eigvecs = np.linalg.eigh(cov)
    order = eigvals.argsort()[::-1]
    eigvals, eigvecs = eigvals[order], eigvecs[:, order]

    # The anti-clockwise angle to rotate our ellipse by
    vx, vy = eigvecs[:, 0][0], eigvecs[:, 0][1]
    theta = np.arctan2(vy, vx)

    # Width and height of ellipse to draw
    width, height = 2 * nstd * np.sqrt(eigvals)
    return Ellipse(
        xy=centre,
        width=width,
        height=height,
        angle=np.degrees(theta),
        **kwargs,
    )


labels, colours = ["Female", "Male"], ["magenta", "blue"]
for gender in (FEMALE, MALE):
    sdata = data[data["gender"] == gender]
    height_mean = np.mean(sdata["height"])
    mass_mean = np.mean(sdata["mass"])
    cov = np.cov(sdata["mass"], sdata["height"])
    ax.scatter(
        sdata["height"],
        sdata["mass"],
        color=colours[gender],
        label=labels[gender],
        s=3,
    )
    e = get_cov_ellipse(
        cov, (height_mean, mass_mean), 3, fc=colours[gender], alpha=0.4
    )
    ax.add_artist(e)

ax.set_xlim(140, 210)
ax.set_ylim(30, 120)
ax.set_xlabel("Height /cm")
ax.set_ylabel("Mass /kg")
ax.legend(loc="upper left", scatterpoints=1)
plt.show()
The function np.arctan2 returns the "two-argument arctangent": np.arctan2(y, x) is the angle in radians between the positive $x$-axis and the point $(x,y)$.
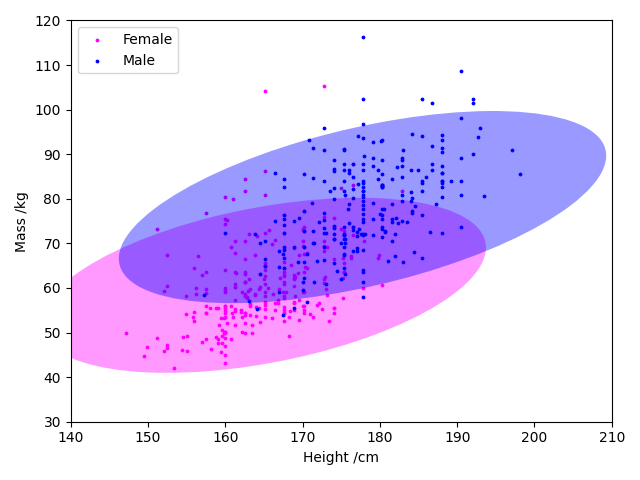
BMI vs height and confidence ellipses.