Learning Scientific Programming with Python (2nd edition)
E7.14: An annotated plot of a share price
Another example of an annotated plot, this time of the share price of BP plc (LSE: BP) with a couple of notable events added to it. The necessary data for this example can be downloaded as bp-share-prices.csv.
import datetime
import numpy as np
import matplotlib.pyplot as plt
from datetime import datetime


def date_to_int(s):
    epoch = datetime(year=1970, month=1, day=1)
    date = datetime.strptime(s, "%Y-%m-%d")
    return (date - epoch).days


dt = np.dtype([("daynum", "i8"), ("close", "f8")])
share_price = np.loadtxt(
    "bp-share-prices.csv",
    skiprows=1,
    delimiter=",",
    usecols=(0, 4),
    converters={0: date_to_int},
    dtype=dt,
)
fig, ax = plt.subplots()
ax.plot(share_price["daynum"], share_price["close"], c="g")
ax.fill_between(
    share_price["daynum"], 0, share_price["close"], facecolor="g", alpha=0.5
)

daymin, daymax = share_price["daynum"].min(), share_price["daynum"].max()
ax.set_xlim(daymin, daymax)

price_max = share_price["close"].max()


def get_xy(date):
    """Return the (x,y) coordinates of the share price on a given date."""
    x = date_to_int(date)
    return share_price[np.where(share_price["daynum"] == x)][0]


# A vertical arrows and labels.
x, y = get_xy("2002-04-30")
ax.annotate(
    "Global oil market\ndownturn",
    (x, y),
    xytext=(x, 725),
    arrowprops=dict(facecolor="black", shrink=0.05, linewidth=0.1),
    ha="center",
)
x, y = get_xy("2010-04-20")
ax.annotate(
    "Deepwater Horizon\noil spill",
    (x, y),
    xytext=(x, 775),
    arrowprops=dict(facecolor="black", shrink=0.05, linewidth=0.1),
    ha="center",
)
x, y = get_xy("2020-03-05")
ax.annotate(
    "Covid pandemic",
    (x, y),
    xytext=(x, 700),
    arrowprops=dict(facecolor="black", shrink=0.05, linewidth=0.1),
    ha="center",
)

years = range(1989, 2026, 2)
ax.set_xticks([date_to_int("{:4d}-01-01".format(year)) for year in years])
ax.set_xticklabels(years, rotation=90)
ax.set_ylim(0, 875)

plt.show()- We need to do some work to read in the date column: we use
datetime(see Section 4.5.3 of the book) to convert it into an integer number of days since some reference date (epoch): here we choose the Unix epoch, 1 January 1970 (date_to_int). ax.fill_betweenfills the region below the plotted line with a single colour.- We rotate the year labels so there's enough room for them (reading bottom-to-top).
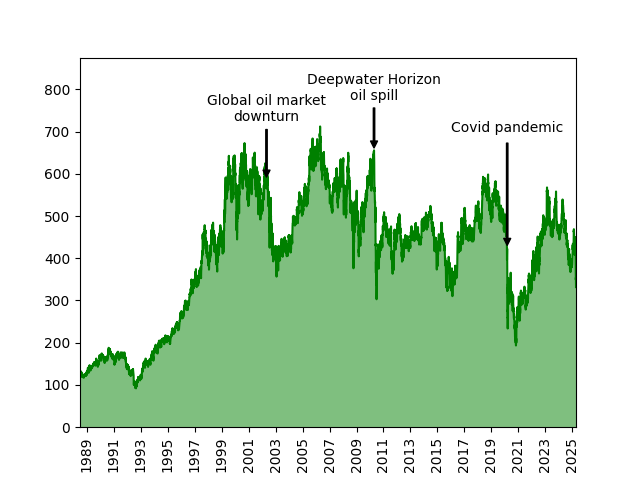
BP's share price on an annotated chart.