Learning Scientific Programming with Python (2nd edition)
E6.5: argmax and argmin
Consider the following oscillating functions on the interval $[0,L]$:
$$
f_n(x) = x(L-x) \sin\frac{2\pi x}{\lambda_n}; \quad \lambda_n = \frac{2L}{n}, \quad n = 1,2,3,\cdots.
$$
The following code defines a two-dimensional array holding values of these functions for $L=1$ on a grid of $N=100$ points (rows) for $n=1,2,\cdots,5$ (columns). The position of the maximum and minimum in each column is calculated with argmax(axis=0) and argmin(axis=0).
import numpy as np
import matplotlib.pyplot as plt


N = 100
L = 1


def f(i, n):
    x = i * L / N
    lam = 2 * L / (n + 1)
    return x * (L - x) * np.sin(2 * np.pi * x / lam)


a = np.fromfunction(f, (N + 1, 5))
min_i = a.argmin(axis=0)
max_i = a.argmax(axis=0)
plt.plot(a, c="k", lw=1)
plt.plot(min_i, a[min_i, np.arange(5)], "v", c="k", markersize=6)
plt.plot(max_i, a[max_i, np.arange(5)], "^", c="k", markersize=6)
plt.xlabel(r"$x$")
plt.ylabel(r"$f_n(x)$")

plt.show()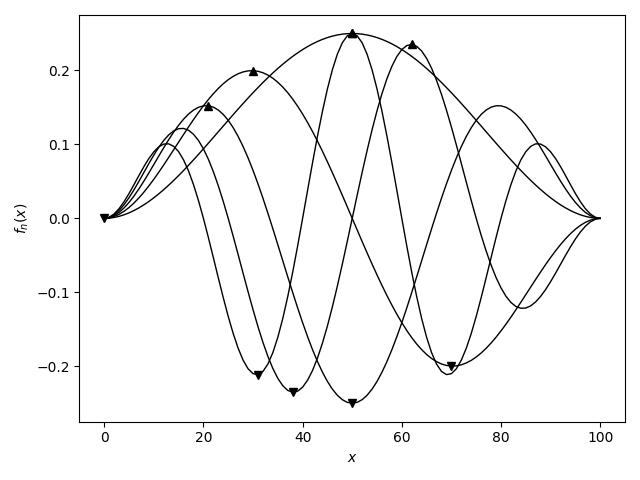
Maxima and minima of the functions $f_n(x)$ described above. Note that only the "global'' maximum and minimum are returned for each function, and that where more than one point has the same maximum or minimum value, only the first is returned.