Learning Scientific Programming with Python (2nd edition)
E8.20: scipy.interpolate.interp2d
Note: interp2d has been removed in SciPy 1.14.0. This example has been modified to use RectBivariateSpline. The default interpolation order is cubic, but the order of the axes is reversed with respect to interp2d, so if we pass these in the order x, y we must take the transpose. More details about migrating code from interp2d is available in the SciPy documentation.
In the following example, we calculate the function
$$
z(x,y) = \sin\left(\frac{\pi x}{2}\right)e^{y/2}
$$
on a grid of points $(x,y)$ which is not evenly-spaced in the $y$-direction. We then use scipy.interpolate.interp2d to interpolate these values onto a finer, evenly-spaced $(x,y)$ grid.
import numpy as np
from scipy.interpolate import RectBivariateSpline
import matplotlib.pyplot as plt

x = np.linspace(0, 4, 13)
y = np.array([0, 2, 3, 3.5, 3.75, 3.875, 3.9375, 4])
X, Y = np.meshgrid(x, y)
Z = np.sin(np.pi * X / 2) * np.exp(Y / 2)

x2 = np.linspace(0, 4, 65)
y2 = np.linspace(0, 4, 65)
f = RectBivariateSpline(x, y, Z.T)
Z2 = f(x2, y2).T

fig, ax = plt.subplots(nrows=1, ncols=2)
ax[0].pcolormesh(X, Y, Z)
ax[0].set_ylim(0, 4)

X2, Y2 = np.meshgrid(x2, y2)
ax[1].pcolormesh(X2, Y2, Z2)
ax[1].set_ylim(0, 4)

plt.show()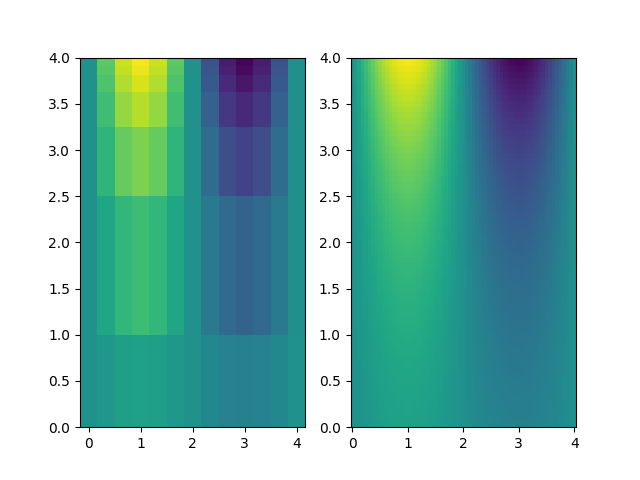
Two-dimensional interpolation. The source data are on the left and the interpolation onto a finer grid is shown on the right.