Learning Scientific Programming with Python (2nd edition)
E8.19: scipy.interpolate.interp1d
This example demonstrates some of the different interpolation methods available in scipy.interpolation.interp1d.
import numpy as np
from scipy.interpolate import interp1d
import matplotlib.pyplot as plt

A, nu, k = 10, 4, 2


def f(x, A, nu, k):
    return A * np.exp(-k * x) * np.cos(2 * np.pi * nu * x)


xmax, nx = 0.5, 8
x = np.linspace(0, xmax, nx)
y = f(x, A, nu, k)

f_nearest = interp1d(x, y, kind="nearest")
f_linear = interp1d(x, y)
f_cubic = interp1d(x, y, kind="cubic")

x2 = np.linspace(0, xmax, 100)
plt.plot(x, y, "o", label="data points")
plt.plot(x2, f(x2, A, nu, k), label="exact")
plt.plot(x2, f_nearest(x2), label="nearest")
plt.plot(x2, f_linear(x2), label="linear")
plt.plot(x2, f_cubic(x2), label="cubic")
plt.legend()
plt.show()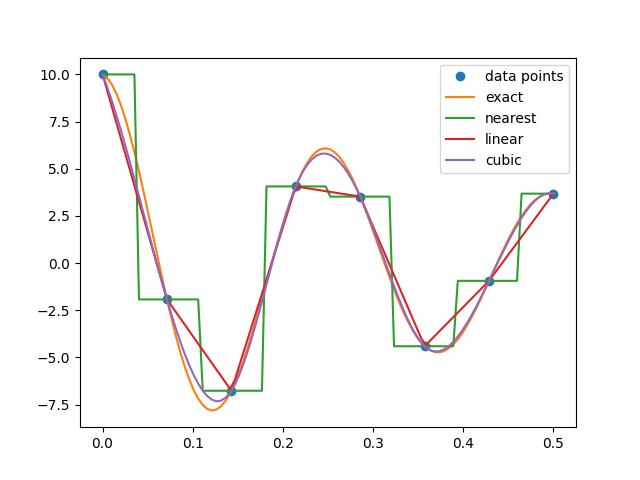
Different interpolation schemes available to scipy.interpolate.interp1d.