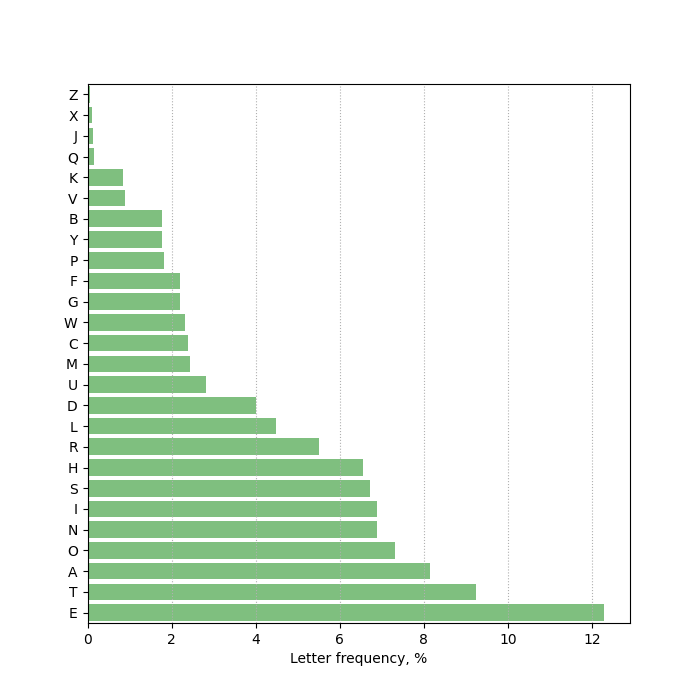
Adapt Example E7.7 to produce a horizontal bar chart, with the bars in order of decreasing letter frequency (i.e. with the most common letter, E, at the bottom).
Solution Q7.4.2
This solution uses pyplot.barh to produce a horizontal bar chart and reverses the $y$-axis to put the highest-frequency letter at the bottom.
import numpy as np
import matplotlib.pyplot as plt

plt.style.use("book2")

text_file = "moby-dick.txt"

letters = "ABCDEFGHIJKLMNOPQRSTUVWXYZ"
# Initialize the dictionary of letter counts: {'A': 0, 'B': 0, ...}
lcount = dict([(l, 0) for l in letters])

# Read in the text and count the letter occurences
for l in open(text_file).read():
    try:
        lcount[l.upper()] += 1
    except KeyError:
        pass
# The total number of letters for normalization
norm = sum(lcount.values())
# A sorted list of (freq, letter) pairs
lfreqs = sorted([(v / norm * 100, k) for k, v in lcount.items()])

fig, ax = plt.subplots(figsize=(7, 7))
# The bar chart, with letters along the horizontal axis and the calculated
# letter frequencies as percentages as the bar height
y = range(26)
ax.barh(
    y,
    width=[item[0] for item in lfreqs],
    height=0.8,
    color="g",
    alpha=0.5,
    align="center",
    orientation="horizontal",
)
ax.set_yticks(y)
ax.set_yticklabels([item[1] for item in lfreqs])
ax.tick_params(axis="y", direction="out")
# NB We want the most common letter at the bottom of our chart, so reverse y:
ax.set_ylim(25.5, -0.5)
ax.xaxis.grid(True, ls=":")
ax.set_xlabel("Letter frequency, %")
plt.show()