Learning Scientific Programming with Python (2nd edition)
E7.2: Median age at first marriage in the US over time
The data read in from the file eg7-marriage-ages.txt, giving the median age at first marriage in the United States for 13 decades since 1890 are plotted by the program below. Grid lines are turned on for both axes with ax.grid() and custom markers are used for the data points themselves.
import numpy as np
import matplotlib.pyplot as plt

year, age_m, age_f = np.loadtxt(
    "eg7-marriage-ages.txt", unpack=True, skiprows=3
)
fig, ax = plt.subplots()

# Plot ages with male or female symbols as markers
ax.plot(
    year,
    age_m,
    marker="$\u2642$",
    markersize=14,
    c="tab:blue",
    lw=2,
    mfc="tab:blue",
    mec="tab:blue",
)
ax.plot(
    year,
    age_f,
    marker="$\u2640$",
    markersize=14,
    c="tab:pink",
    lw=2,
    mfc="tab:pink",
    mec="tab:pink",
)
ax.grid()

ax.set_xlabel("Year")
ax.set_ylabel("Age")
ax.set_title("Median age at first marriage in the US, 1890 - 2010")

plt.show()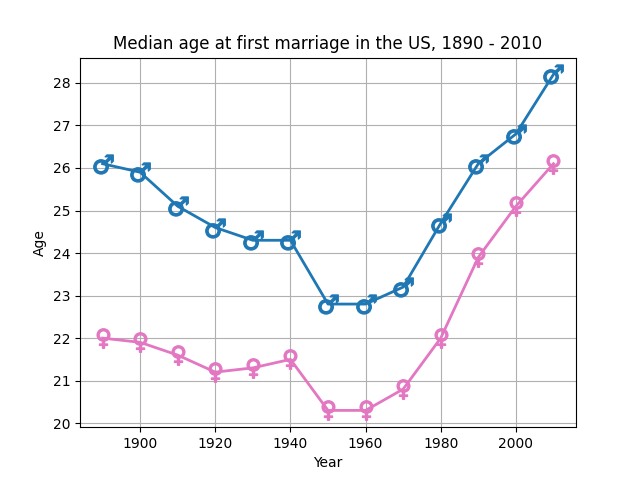
Median age at First Marriage in the US (1890-2010) for men and women.