Learning Scientific Programming with Python (2nd edition)
E7.26: A torus
The parametric description of a torus with radius $c$ and tube radius $a$ is $$ \begin{align*} x &= (c + a\cos\theta) \cos\phi\\ y &= (c + a\cos\theta) \sin\phi\\ z &= a \sin\theta \end{align*} $$ for $\theta$ and $\phi$ each between $0$ and $2\pi$. The code below outputs two views of a torus rendered as a surface plot.
import numpy as np
import matplotlib.pyplot as plt
from mpl_toolkits.mplot3d import Axes3D

n = 100

theta = np.linspace(0, 2.0 * np.pi, n)
phi = np.linspace(0, 2.0 * np.pi, n)
theta, phi = np.meshgrid(theta, phi)
c, a = 2, 1
x = (c + a * np.cos(theta)) * np.cos(phi)
y = (c + a * np.cos(theta)) * np.sin(phi)
z = a * np.sin(theta)

fig, axes = plt.subplots(nrows=1, ncols=2, subplot_kw={"projection": "3d"})
ax1, ax2 = axes
ax1.set_zlim(-3, 3)
ax1.plot_surface(x, y, z, rstride=5, cstride=5, color="k", edgecolors="w")
ax1.view_init(36, 26)

ax2.set_zlim(-3, 3)
ax2.plot_surface(x, y, z, rstride=5, cstride=5, color="k", edgecolors="w")
ax2.view_init(0, 0)
ax2.set_xticks([])

plt.show()- We need $\theta$ and $\phi$ to range over the interval $(0,2\pi)$ independently, so use a
meshgrid. - Note that we can use keywords such as
edgecolorsto style the polygon patches created byax.plot_surface. - Elevation angle above the $xy$-plane of $36^\circ$, azimuthal angle in the $xy$-plane of $26^\circ$.
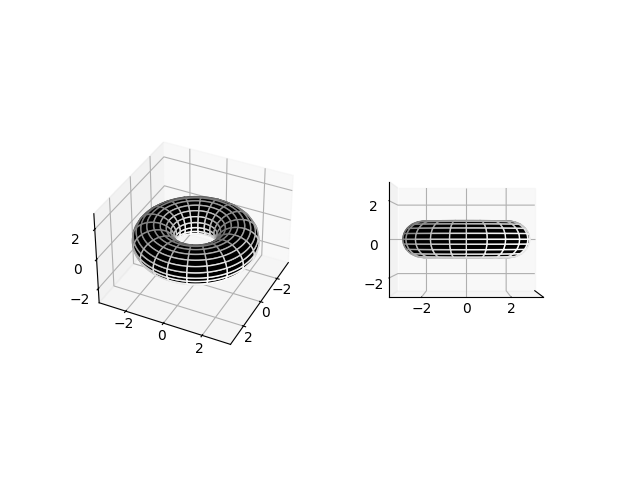
Two views of a torus: (a) $\theta = 36^\circ$, $\phi = 26^\circ$, (b) $\theta = 0^\circ$, $\phi = 0^\circ$