Learning Scientific Programming with Python (2nd edition)
E7.20: A simple contour plot
This program produces a filled contour plot of a function, labels the contours and provides some custom styling for their colours.
import numpy as np
import matplotlib.pyplot as plt
import matplotlib.cm as cm

X = np.linspace(0, 1, 100)
Y = X.copy()
X, Y = np.meshgrid(X, Y)
alpha = np.radians(25)
cX, cY = 0.5, 0.5
sigX, sigY = 0.2, 0.3
rX = np.cos(alpha) * (X - cX) - np.sin(alpha) * (Y - cY) + cX
rY = np.sin(alpha) * (X - cX) + np.cos(alpha) * (Y - cY) + cY

Z = (
    (rX - cX)
    * np.exp(-(((rX - cX) / sigX) ** 2))
    * np.exp(-(((rY - cY) / sigY) ** 2))
)
fig, ax = plt.subplots()

# Reversed Greys colourmap for filled contours
cpf = ax.contourf(X, Y, Z, 20, cmap=cm.Greys_r)
# Set the colours of the contours and labels so they're white where the
# contour fill is dark (Z < 0) and black where it's light (Z >= 0)
colours = ["w" if level < 0 else "k" for level in cpf.levels]
cp = ax.contour(X, Y, Z, 20, colors=colours)
ax.clabel(cp, fontsize=10, colors=colours)
plt.show()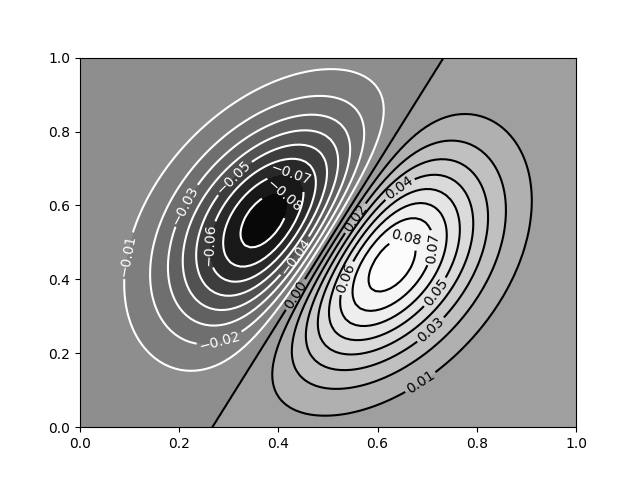
A simple contour plot.