Where are the world's nuclear power plants?
Posted on 18 February 2021
As of April 2020, there were 440 operational nuclear power reactors in the world. They are listed on this Wikipedia page, which can be scraped using the code at the bottom of this post for their important details, including their locations as latitude and longitude coordinates. The result of this scraping is the CSV file operational-nuclear-power-stations.csv, which can be analysed using pandas.
First, some imports and definitions:
import pandas as pd
import matplotlib.pyplot as plt

# A glossary of reactor type abbreviations.
reactor_types = {
    'BWR': 'Boiling Water Reactor',
    'GCR': 'Gas-Cooled Reactor',
    'LWGR': 'Light Water Graphite Reactor (RBMK)',
    'PHWR': 'Pressurized Heavy Water Reactor',
    'PWR': 'Pressurized Water Reactor',
    'SFR': 'Sodium-Cooled Fast Reactor'
}
Read in the data:
# Read in the CSV data to a DataFrame.
df = pd.read_csv('operational-nuclear-power-stations.csv', index_col=0,
                 thousands=',')
pandas' groupby function can be used to collect together the reactors in each power plant, and find their total gross capacity (that is, the amount of power produced by the plant before any used by the plant has been taken into account):
# Group all the nuclear power plants in each country: each plant typically
# has several reactors. Sum the reactor capacities and store the location.
g = df.groupby(['Country', 'Name'])
df2 = pd.DataFrame({'Gross Capacity /MW': g['Gross Capacity /MW'].sum(),
                    'Latitude': g['Latitude'].mean(),
                    'Longitude': g['Longitude'].mean()})

df2.sort_values('Gross Capacity /MW', ascending=False)[:10]

                         Gross Capacity /MW   Latitude   Longitude
Country     Name
Canada      Bruce                       6654  44.325278  -81.599444
China       Yangjiang                   6516  21.708333  112.261111
South Korea Hanul                       6216  37.092778  129.383611
            Hanbit                      6193  35.415000  126.423889
Ukraine     Zaporizhzhia                6000  47.512222   34.585833
France      Gravelines                  5706  51.015278    2.136111
            Paluel                      5528  49.858056    0.635556
China       Fuqing                      5470  25.445833  119.447222
France      Cattenom                    5448  49.415833    6.218056
China       Tianwan                     5386  34.686944  119.459722
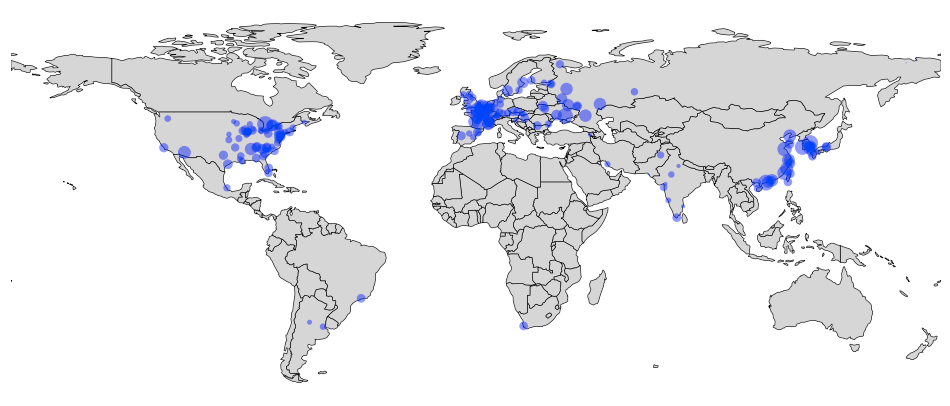
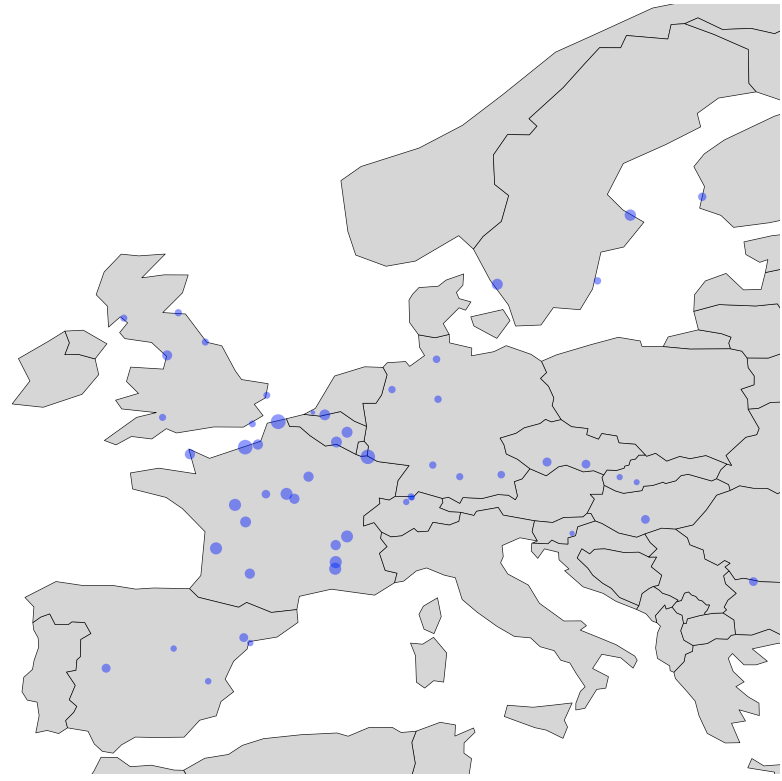
The geopandas library can be used to plot the location of the power plants on a map:
# Plot the power plant locations on a map, using geopandas.
import geopandas
world = geopandas.read_file(geopandas.datasets.get_path('naturalearth_lowres'))

def set_lims(ax, region):
    """Set the Axes limits corresponding to a chosen region of the map."""
    # latitude, longitude limits for different regions of the world.
    lims = {'World': ((-60, 90), (-180, 180)),
            'Europe': ((35, 70), (-10, 25)),
            'North America': ((15, 55), (-130, -70)),
            'East Asia': ((10, 45), (100,  145)),
            'Eastern Europe': ((35, 70), (15, 50)),
            'South Asia': ((0, 40), (60, 90))}
    ax.set_ylim(*lims[region][0])
    ax.set_xlim(*lims[region][1])

def plot_map(region='World'):
    """Plot the power plant locations for a given region of the world."""

    fig, ax = plt.subplots(figsize=(12, 10), dpi=100)
    # First plot and style the world map.
    world.plot(ax=ax, color="0.8", edgecolor='black', linewidth=0.5)
    # The reactor plant circles will be scaled according to their gross capacity.
    sizes = (df2['Gross Capacity /MW'] / 50)
    ax.scatter(df2['Longitude'], df2['Latitude'], s=sizes, fc='b', ec='none', alpha=0.5)
    set_lims(ax, region)
    ax.axis('off')
Different regions of the world have been defined in the above code. For the entire world the usage is:
plot_map()

To zoom in to Europe, for example, use:
plot_map('Europe')

A different way of grouping (by country but not also by plant name) gives the number of nuclear reactors in each country.
# Now re-group by country and count the number of nuclear power
# reactors in each country.
g2 = df.groupby('Country').size().sort_values(ascending=False).rename(
                        'Number of Nuclear Power Reactors')
g2

Country
United States     91
France            56
China             49
Russia            37
South Korea       24
India             21
Canada            19
Ukraine           15
United Kingdom    15
Japan              9
Sweden             7
Spain              7
Belgium            7
Czech Republic     6
Germany            6
Pakistan           5
Switzerland        4
Finland            4
Taiwan             4
Hungary            4
Slovakia           4
Argentina          3
Romania            2
Bulgaria           2
Brazil             2
South Africa       2
Mexico             2
Iran               1
Netherlands        1
Slovenia           1
Armenia            1
Name: Number of Nuclear Power Reactors, dtype: int64
There as many nuclear power reactors in Belgium as there are in the whole of the Southern Hemisphere.
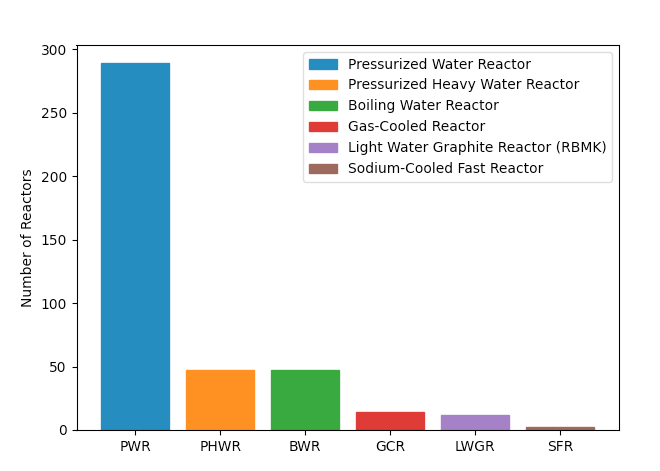
Finally, we could, instead, group by the type of reactor and plot a bar chart across all nuclear power reactors in the world.
# Group by reactor type and count.
gtype = df.groupby('Type').size().sort_values(ascending=False).to_frame(
                            'Number of Nuclear Power Reactors')
# Insert the reactor description before the number of reactors.
gtype.insert(0, 'Description', gtype.index.map(reactor_types))
gtype

                              Description  Number of Nuclear Power Reactors
Type
PWR             Pressurized Water Reactor                               289
PHWR      Pressurized Heavy Water Reactor                                47
BWR                 Boiling Water Reactor                                47
GCR                    Gas-Cooled Reactor                                14
LWGR  Light Water Graphite Reactor (RBMK)                                12
SFR            Sodium-Cooled Fast Reactor                                 2
Labelling the bar chart requires a bit of work in generating proxy ("fake") objects that can be used to create a legend:
# Plot the reactor types on a colourful barchart, suitable annotated.
# Take the colours used for each bar from the default colour cycle.
colour_cycle = plt.rcParams['axes.prop_cycle'].by_key()['color']
fig, ax = plt.subplots(figsize=(7, 5), dpi=100)
bars = ax.bar(gtype.index, gtype['Number of Nuclear Power Reactors'])
# For the legend, we'll need some proxy Artists to generate handles from.
handles, labels = [], []
for i, bar in enumerate(bars):
    c = colour_cycle[i]
    bar.set_color(c)
    handles.append(plt.Rectangle((0,0), 1, 1, color=c))
    labels.append(reactor_types[gtype.iloc[i].name])
# Add the legend, using the handles set to the proxy Rectangles.
ax.legend(handles, labels)
ax.set_ylabel('Number of Reactors')

For anyone interested in scraping Wikipedia for this data in future, here is the script I used:
import os
import sys
import json
import csv
import urllib.request
from pprint import pprint
from bs4 import BeautifulSoup

html_file = 'nuclear-power-station-list.html'
if os.path.exists(html_file):
    # If the Wikipedia page has been saved to a local copy, use it.
    html = open(html_file).read()
else:
    # Otherwise, pull it from the internet and save a local copy.
    print('Retrieving nuclear power station list from Wikipedia...')
    url = 'https://en.wikipedia.org/wiki/List_of_nuclear_reactors'
    req = urllib.request.urlopen(url)
    html = req.read().decode()
    with open(html_file, 'w') as fo:
        fo.write(html)

# Turn the HTML into delicious soup.
soup = BeautifulSoup(html, 'html.parser')

# Retrieve the countries and their anchor links from the heading menu.
contents_h2 = soup.find('h2', id='mw-toc-heading')
first_li = contents_h2.find_next('li')
ul = contents_h2.find_next('ul')
atags = ul.find_all('a')
hrefs = dict((atag.attrs['href'],
              atag.find('span', {'class': "toctext"}).string)
                                            for atag in atags[:-3])

def get_coords(url):
    """Get the coordinates of a power plant from a Wikipedia URL."""

    if not url:
        return {}
    # There's one special case without an embedded location.
    if url == '/wiki/Sizewell_nuclear_power_stations':
        return {"lat":52.215,"lon":1.61972}

    url = 'https://en.wikipedia.org' + url
    wname = url.split('/')[-1] + '.html'
    local_wname = 'w/' + wname
    if os.path.exists(local_wname):
        # Use a local copy fof the HTML file if it exists.
        print('Retrieving local HTML file', local_wname, '...')
        html = open(local_wname).read()
    else:
        # Otherwise, retrieve a copy from the internet and save it.
        print('Retrieving HTML file from Wikipedia...')
        req = urllib.request.urlopen(url)
        html = req.read().decode()
        with open(local_wname, 'w') as fo:
            fo.write(html)

    # Somewhere in the HTML, near the beginning, is a scrap of JSON encoding
    # the latitude and longitude of the power plant. Find it and parse it.
    idx = html.index('"wgCoordinates"')
    i, j = html[idx:].index('{') + idx, html[idx:].index('}') + idx
    s_js = html[i:j+1]
    coords = json.loads(s_js)

    print(coords)
    return coords


# We build a dictionary of countries, containing a dictionary of plant names,
# containing a list of three items: (1) a Wikipedia URL for the plant; (2) a
# dictionary of the reactor units at the plant; (3) the latitude and longitude
# of the plant. The dictionary of units is keyed by the unit identifier and has
# as its value a list of the type, model, status, and net and gross capacity of
# that unit.
countries = {}
k = 0
nop = 0
# To ensure we capture all the operational units, keep track of the different
# statuses reported in the data.
statuses = set()

for href, country_name in hrefs.items():
    # New country encountered: start a new dict for it.
    countries[country_name] = {}
    # Locate the data table for this country's nuclear reactors.
    c = soup.find('span', {'id': href[1:]})
    t = c.find_next('table')
    j, rowspan = 0, 0
    # Iterate over all the rows of the table.
    for i, tr in enumerate(t.find_all('tr')):
        td = tr.find_all('td')
        if not td:
            # Skip the header rows.
            continue
        if j == rowspan:
            # If we're here, we're looking at a new power plant (e.g. we're
            # done parsing the rowspan reactor units at the previous plants).
            rowspan = int(td[0].attrs.get('rowspan', 1))
            name = td.pop(0)
            # Try to get the name and link to this power plant.
            atags = name.find_all('a')
            if atags:
                # Great – there was a link in the td cell.
                url = atags[0].attrs['href']
                if url.startswith('#cite_note'):
                    # Not so great - it wasn't a link to a Wikipedia page about
                    # the power plant (e.g. the plant is planned but not built.)
                    url, name = None, name.next
                else:
                    # Get the pland name from the text inside the <a> tag.
                    name = atags[0].string
            else:
                # No link, just (presumably) a reactor name.
                url = None
                name = name.string
            # Start a list of reactors for this power plant and reset the
            # counter for the reactor units.
            countries[country_name][name] = [url, {}]
            j = 0

        # Parse the reactor units from the remaining cells on this <tr> row.
        unit = td[0].string
        reactor_type, reactor_model, status, net, gross = [
                                                t.text for t in td[1:6]]
        statuses.add(status)
        if status.startswith('Operational'):
            # We only really care about the operational units.
            countries[country_name][name][1][unit] = [t.text for t in td[1:6]]
            if len(countries[country_name][name]) < 3:
                # If we didn't already get the location coordinates for this
                # plant, do it now.
                coords = get_coords(url)
                countries[country_name][name].append(coords)
            # Increment the counter for the number of operational plants.
            nop += 1
        # Increment the counter for the number of reactor units.
        j += 1
    # Increment the counter for the number of countries (useful for testing).
    k += 1

pprint(countries)
print(nop)
print(statuses)

def write_csv():
    """Write our nested dictionary to a CSV file."""

    with open('operational-nuclear-power-stations.csv', 'w') as csvfile:
        writer = csv.writer(csvfile)
        writer.writerow(['Country', 'Name', 'Latitude', 'Longitude', 'Unit',
                 'Type', 'Model', 'Net Capacity /MW', 'Gross Capacity /MW'])
        for country, reactors in countries.items():
            for reactor_name, reactor_details in reactors.items():
                try:
                    coords = reactor_details[2]
                except IndexError:
                    continue
                for unit, unit_details in reactor_details[1].items():
                    reactor_type, model, status, net, gross = unit_details
                    # We tolerate the duplicated fields for each reactor in
                    # the same plant, country, etc. for the sake of making
                    # it straightforward to read into pandas later.
                    writer.writerow([country, reactor_name, coords['lat'],
                                     coords['lon'], unit, reactor_type, model,
                                     net, gross])

def write_json():
    """Write the nested dictionary of reactor data as a JSON file."""

    with open('operational-nuclear-power-stations.json', 'w') as fo:
        print(json.dumps(countries), file=fo)

write_csv()