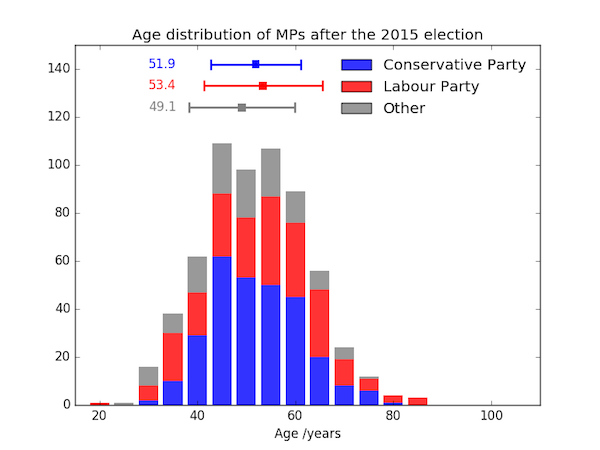
What is the average age of an MP in each party?
Posted on 02 March 2017
Wikipedia contains biographical information about most MPs which can be scraped using Python and the BeautifulSoup library.
First we need a list of MPs. It doesn't have to be particularly up-to-date, so I'm using the list of those MPs elected at the 2015 General Election. The MP's names (with links to their Wikipedia pages) are provided in a table which (looking at the HTML source) we can identify as the only one with class attribute 'sortable'. After skipping the header row, we can parse out the MPs' names, Wikipedia links, parliamentary party, and constituency information from the remaining rows, and write them (redirect the output of the script) to a tab-delimited file, 'MP_wikis.tsv'. We'll also attach an ID to each MP as the integer counter starting at 1 for the first MP in the list.
import urllib.request
import re
from bs4 import BeautifulSoup

base_url = 'http://en.wikipedia.org/wiki/'
list_page = 'List_of_MPs_elected_in_the_United_Kingdom_general_election,_2015'

# Wikipedia URL for list of MPs.
url = base_url + list_page
# Get the page contents and parse.
req = urllib.request.urlopen(url)
article = req.read()
soup = BeautifulSoup(article.decode(), 'html.parser')

def get_title_and_link(cell):
    """Get the title and href attributes from the a tag in the cell element."""

    a = cell.find_all('a')[0]
    # The name link title is the MPs name, sometimes followed by
    # ' (politician)', ' (British politician)', and so on, so strip out that
    # sort of thing.
    title = a['title'].split(' (')[0]
    # strip '/wiki/' from the link
    link = a['href'][6:]
    return title, link

# The names and links we want are in the only sortable table on the page.
table = soup.find_all('table', class_='sortable')[0]
# Iterate over its rows, extracting the href and title attributes of the a
# tag (link) inside the 3rd column, which holds the MPs names. Skip the header.
for i, row in enumerate(table.find_all('tr')[1:]):
    cells = row.find_all('td')
    constituency_cell, party_cell, name_cell = cells[:5:2]
    constituency_name, constituency_link =get_title_and_link(constituency_cell)
    party, _ = get_title_and_link(party_cell)
    name, link = get_title_and_link(name_cell)
    print('\t'.join((str(i+1), name, link, party, constituency_name,
                     constituency_link)))
Now to retrieve the MPs' Wikipedia articles themselves. I'm going to put them in a subdirectory called MP-wikis. Just loop over the links from our list file, 'MP_wikis.tsv' and fetch the webpages, saving them as MP-wikis/MP-<ID>.html.
import urllib.request

base_url = 'http://en.wikipedia.org/wiki/'

list_name = 'MP_wikis.tsv'
for line in open(list_name):
    fields = line.split('\t')
    mp_id, name, link = fields[:3]
    print(mp_id, name)
    # Wikipedia URL for list of MPs.
    url = base_url + link
    # Get the page contents and parse.
    req = urllib.request.urlopen(url)
    article = req.read().decode()
    with open('MP-wikis/MP-{}.html'.format(mp_id), 'w') as fo:
        fo.write(article)
Parsing the MPs' Wikipedia pages for their dates of birth is straighforward because Wikipedia holds this information in a span element with the class 'bday' which we can look for with BeautifulSoup's find_all method. Some 30 MPs in the list do not have birth dates known to Wikipedia, so we'll have to skip these.
import glob
from bs4 import BeautifulSoup

NUMBER_OF_MPS = 650

for mp_id in range(1, NUMBER_OF_MPS+1):
    filename = 'MP-wikis/MP-{}.html'.format(mp_id)
    soup = BeautifulSoup(open(filename), 'html.parser')
    bday = soup.find_all('span', attrs={'class': 'bday'})
    try:
        print('{}\t{}'.format(mp_id, bday[0].text))
    except IndexError:
        pass
The output of this script should be redirected to the file 'MP_dobs.tsv'
Finally, to plot a histogram of the MPs' ages, we first need to read in 'MP_wikis.tsv' (so that we know each MP's party) and 'MP_dobs.tsv', and calculate their age (as of today) for each. This is made a bit easier by defining a class, MemberOfParliament, to represent each MP with a method for parsing lines from the 'MP_dobs.tsv' file and another for setting an age attribute.
The stacked bar chart is plotted from a NumPy histogram using the bottom parameter to pyplot.bar, and the mean and standard deviation ages added as errorbar plots. There's no easy way to make each errorbar and its cap have a different colour, so three separate errorbar plots with one point each are used.
from collections import namedtuple
from datetime import datetime
import numpy as np
import matplotlib.pyplot as plt

class MemberOfParliament:
    """A class representing a member of parliament."""

    def __init__(self):
        self.age = None

    @classmethod
    def read_MP_line(self, line):
        """Create a MemberOfParliament object from a line of MP_wikis.tsv."""

        fields = line.split('\t')
        mp = MemberOfParliament()
        (s_mp_id, mp.name, mp.wiki_link, mp.party, mp.constituency,
         mp.constituency_wiki_link) = fields[:6]
        mp.mp_id = int(s_mp_id)
        return mp

    def set_age_from_dob(self, dob, now=None):
        """Set the MP's age from the provided date of birth, dob."""

        if now is None:
            now = datetime.now()
        self.age = now.year - dob.year
        if (now.month, now.day) < (dob.month, dob.day):
            self.age -= 1


def read_MPs_details(list_name='MP_wikis.tsv'):
    """Read in all MPs details from tsv file list_name."""

    MP = {}
    with open(list_name) as fi:
        for line in fi:
            mp = MemberOfParliament.read_MP_line(line)
            MP[mp.mp_id] = mp
    return MP
MPs = read_MPs_details()

# Add MP age to each MemberOfParliament instance.
now = datetime.now()
for line in open('MP_dobs.tsv'):
    fields = line.split()
    mp_id = int(fields[0])
    dob = datetime.strptime(fields[1].strip(), '%Y-%m-%d')
    MPs[mp_id].set_age_from_dob(dob, now)

# Create separate arrays of MP ages for Conservative, Labour and Other parties.
CON, LAB = 'Conservative Party', 'Labour Party'
con_mp_ages = np.array([mp.age for mp in MPs.values()
                    if mp.party==CON and mp.age is not None])
lab_mp_ages = np.array([mp.age for mp in MPs.values()
                    if mp.party==LAB and mp.age is not None])
other_mp_ages = np.array([mp.age for mp in MPs.values()
                    if mp.party not in (CON, LAB) and mp.age is not None])

# Plot a stacked barchart from the three groups of MP ages.
fig, ax = plt.subplots()
bins = np.arange(17.5,100,5)
con_hist, bin_edges = np.histogram(con_mp_ages, bins=bins)
lab_hist, bin_edges = np.histogram(lab_mp_ages, bins=bins)
other_hist, bin_edges = np.histogram(other_mp_ages, bins=bins)
bin_centres = 0.5 * (bin_edges[:-1] + bin_edges[1:])
kwargs = {'alpha': 0.8, 'width': 4, 'ec': 'none', 'align': 'center'}
colors = ['b','r','gray']
ax.bar(bin_centres, con_hist, fc=colors[0], label=CON, **kwargs)
ax.bar(bin_centres, lab_hist, bottom=con_hist, fc=colors[1], label=LAB,
       **kwargs)
ax.bar(bin_centres, other_hist, bottom=con_hist+lab_hist, fc=colors[2],
       label='Other', **kwargs)

# Calculate mean and standard deviation of each group
means = [con_mp_ages.mean(), lab_mp_ages.mean(), other_mp_ages.mean()]
stds = [con_mp_ages.std(), lab_mp_ages.std(), other_mp_ages.std()]

# Plot the mean with errorbars at ±1σ (y-positioning by hand)
ypos = [142, 133, 124]
ax.scatter(means, ypos, c=colors, marker='s', edgecolors='none', s=60)

for mean, y, std, color in zip(means, ypos, stds, colors):
    ax.errorbar(mean, y, xerr=std, color=color, elinewidth=2, capsize=5,
                capthick=2)

# Add the mean ages alongside the error bars
for i in range(3):
    ax.annotate('{:.1f}'.format(means[i]), (30, ypos[i]), va='center',
                color=colors[i])

# Tidy up and save figure.
ax.set_xlabel('Age /years')
ax.set_title('Age distribution of MPs after the 2015 election')
ax.legend(frameon=False)
ax.set_xlim(15,110)
ax.set_ylim(0,150)
plt.show()