Types of plasma
Posted on 02 September 2018
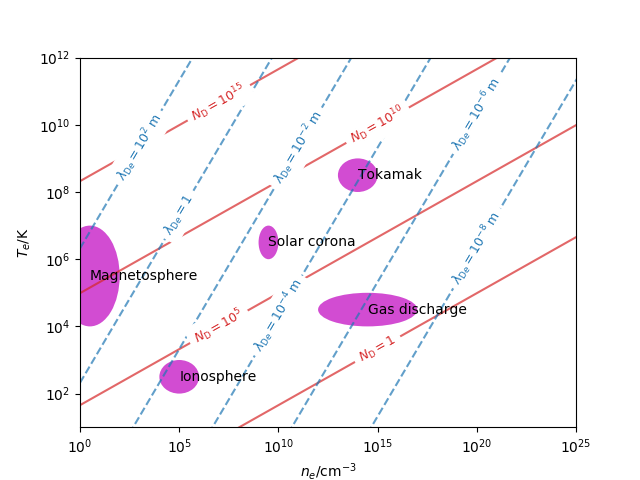
Two important parameters in plasma physics are the electron Debye length, $\lambda_{\mathrm{D}e}$, a measure of the distance over which charge-screening effects occur and deviations from quasi-neutrality are observed, and the number of paricles in a "Debye cube" (of side length $\lambda_{\mathrm{D}e}$), $N_\mathrm{D}$.
In terms of the electron temperature, $T_e$ (expressed as an energy) and number density, $n_e$,
$$ \lambda_{\mathrm{D}e} = \sqrt{\frac{\epsilon_0 T_e}{e^2n_e}}, \quad N_\mathrm{D} = n_e\lambda_{\mathrm{D}e}^3. $$
The condition for an ionized gas to be considered a plasma is $N_\mathrm{D} \gg 1$: many charged particles within a Debye cube.
Below we plot lines of constant $\lambda_{\mathrm{D}e}$ and $N_\mathrm{D}$ for a range of typical values of $n_e$ and $T_e$ on a log scale and indicate the regimes corresponding to certain kinds of plasma.
The code to generate this plot is given below. The lines could have been plotted as contours on a two-dimensional grid, but here we calculate them explicitly using the formulae obtained by taking the logarithm and rearranging the above expressions:
$$ \begin{align*} \log T_e & = \frac{2}{3}\log N_\mathrm{D} + \log \left(\frac{e^2}{\epsilon_0}\right) + \frac{1}{3}\log n_e\\ \log T_e &= 2\log \lambda_{\mathrm{D}e} + \log \left(\frac{e^2}{\epsilon_0}\right) + \log n_e \end{align*} $$
with some extra terms to allow for unit conversions.
import numpy as np
from scipy.constants import k as kB, epsilon_0, e
import matplotlib.pyplot as plt
from matplotlib.patches import Ellipse

def calc_logTe_for_ND(logne, logND):
    """Return the log of electron temperature (in K) from ne for ND.

    logne is log10 of the electron density in cm-3,
    logND is log10 of the number of particles in a Debye cube.

    """

    # The factor (term in log-space) here converts from log10(Joules)
    # to log10(K).
    fac = np.log10(kB)
    # Add 6 to logne for the conversion from cm-3 to m-3.
    return 2 * logND / 3 + np.log10(e**2 / epsilon_0) + (logne + 6)/3 - fac

def calc_logTe_for_lamD(logne, loglamD):
    """Return the log of electron temperature (in K) from ne for lamD.

    logne is log10 of the electron density in cm-3,
    loglamD is log10 of the electron Debye length in m.

    """

    # The factor (term in log-space) here converts from log10(Joules)
    # to log10(K).
    fac = np.log10(kB)
    # Add 6 to logne for the conversion from cm-3 to m-3.
    return 2*loglamD + np.log10(e**2/epsilon_0) + logne + 6 - fac

fig, ax = plt.subplots()

# Electron density grid in cm-3.
logne_grid = np.array((0,30))

# The grid of log10(ND) values to plot lines for.
logND_grid = (0, 5, 10, 15)
# We need to save the logTe values for plotting the labels later.
logTe_by_ND_grid = {}
for logND in logND_grid:
    logTe_by_ND_grid[logND] = calc_logTe_for_ND(logne_grid, logND)
    ax.plot(logne_grid, logTe_by_ND_grid[logND], 'tab:red', alpha=0.7)

# The grid of log10(lamda_De) values to plot lines for.
loglamD_grid = (2, 0, -2, -4, -6, -8)
# We need to save the logTe values for plotting the labels later.
logTe_by_lamD_grid = {}
for loglamD in loglamD_grid:
    logTe_by_lamD_grid[loglamD] = calc_logTe_for_lamD(logne_grid, loglamD)
    kwargs = {'c': 'tab:blue', 'alpha': 0.7, 'ls': '--'}
    ax.plot(logne_grid, logTe_by_lamD_grid[loglamD], **kwargs)

def add_plasma_patch(xy, width, height, label):
    """Add an ellipse of size width x height to the plot.

    The ellipse is centred at coordinates xy and labelled.

    """

    kwargs = {'fc': 'm', 'alpha': 0.7}
    plasma_patch = Ellipse(xy, width, height, **kwargs)
    ax.add_patch(plasma_patch)
    ax.annotate(xy=xy, s=label)

# These are the plasmas we consider for illustration.
add_plasma_patch((0.5, 5.5), 3, 3, 'Magnetosphere')
add_plasma_patch((5, 2.5), 2, 1, 'Ionosphere')
add_plasma_patch((9.5, 6.5), 1, 1, 'Solar corona')
add_plasma_patch((14.5, 4.5), 5, 1, 'Gas discharge')
add_plasma_patch((14, 8.5), 2, 1, 'Tokamak')

# Fix the Axes limits
ax.set_xlim(0,25)
ax.set_ylim(1,12)


def annotate_line(x, y, label, xylabel=None, colour='k'):
    """Annotate a line of constant Nd or lambda_De.

    The text label is rotated to coincide with the line through
    (x[0], y[0]) and (x[1], y[1]) and centred at xylabel. If not provided,
    xylabel is set to the centre of the line.

    """

    rotn = np.degrees(np.arctan2(y[1]-y[0], x[1]-x[0]))
    if xylabel is None:
        xylabel = ((x[0]+x[1])/2, (y[0]+y[1])/2)
    text = ax.annotate(label, xy=xylabel, ha='center', va='center',
                       backgroundcolor='white', color=colour, size=9)
    p1 = ax.transData.transform_point((x[0], y[0]))
    p2 = ax.transData.transform_point((x[1], y[1]))
    dy = (p2[1] - p1[1])
    dx = (p2[0] - p1[0])

    rotn = np.degrees(np.arctan2(dy, dx))
    text.set_rotation(rotn)

# Set the Axes labels and tick labels (in scientific notation).
ax.set_xticklabels(['$10^{{{:d}}}$'.format(logne)
                            for logne in range(0,26,5)])
ax.set_yticklabels(['$10^{{{:d}}}$'.format(logTe)
                            for logTe in range(0,13,2)])
ax.set_xlabel('$n_e/\mathrm{cm^{-3}}$')
ax.set_ylabel('$T_e/\mathrm{K}$')

# Add the labels to lines of constant ND.
# xlabels is the x-coordinate of the centre of each label.
xlabels = (None, 7, None, 7)
for logND, xlabel in zip(logND_grid, xlabels):
    if logND:
        label = '$N_\mathrm{{D}}=10^{{{:d}}}$'.format(logND)
    else:
        label = '$N_\mathrm{{D}}=1$'
    if xlabel is not None:
        ylabel = calc_logTe_for_ND(xlabel, logND)
        xylabel = (xlabel, ylabel)
    else:
        xylabel = None
    annotate_line(logne_grid, logTe_by_ND_grid[logND], label, xylabel,
                  colour='tab:red')

# Add the labels to lines of constant lambda_De.
# xlabels is the x-coordinate of the centre of each label.
xlabels = (3, 5, 11, 10, 20, 20)
for loglamD, xlabel in zip(loglamD_grid, xlabels):
    if loglamD:
        s_val = '10^{{{:d}}}\;\mathrm{{m}}'.format(loglamD)
    else:
        s_val = '0'
    label = '$\lambda_{{\mathrm{{D}}e}} = {}$'.format(s_val)
    if xlabel is not None:
        ylabel = calc_logTe_for_lamD(xlabel, loglamD)
        xylabel = (xlabel, ylabel)
    else:
        xylabel = None

    annotate_line(logne_grid, logTe_by_lamD_grid[loglamD], label, xylabel,
                  colour='tab:blue')

plt.savefig('plasma-types.png')
plt.show()