Turning an image into a sticker chart
Posted on 19 September 2019
To produce a children's sticker chart from a provided image, the following code divides it into squares (which can be cut out) and produces further images with matching labels for the reverse side of the printed image and a piece of card onto which the squares can be stuck (you need to provide your own glue).
The Pillow library is used to edit the images, and the Google truetype font file Manjari-Bold.ttf
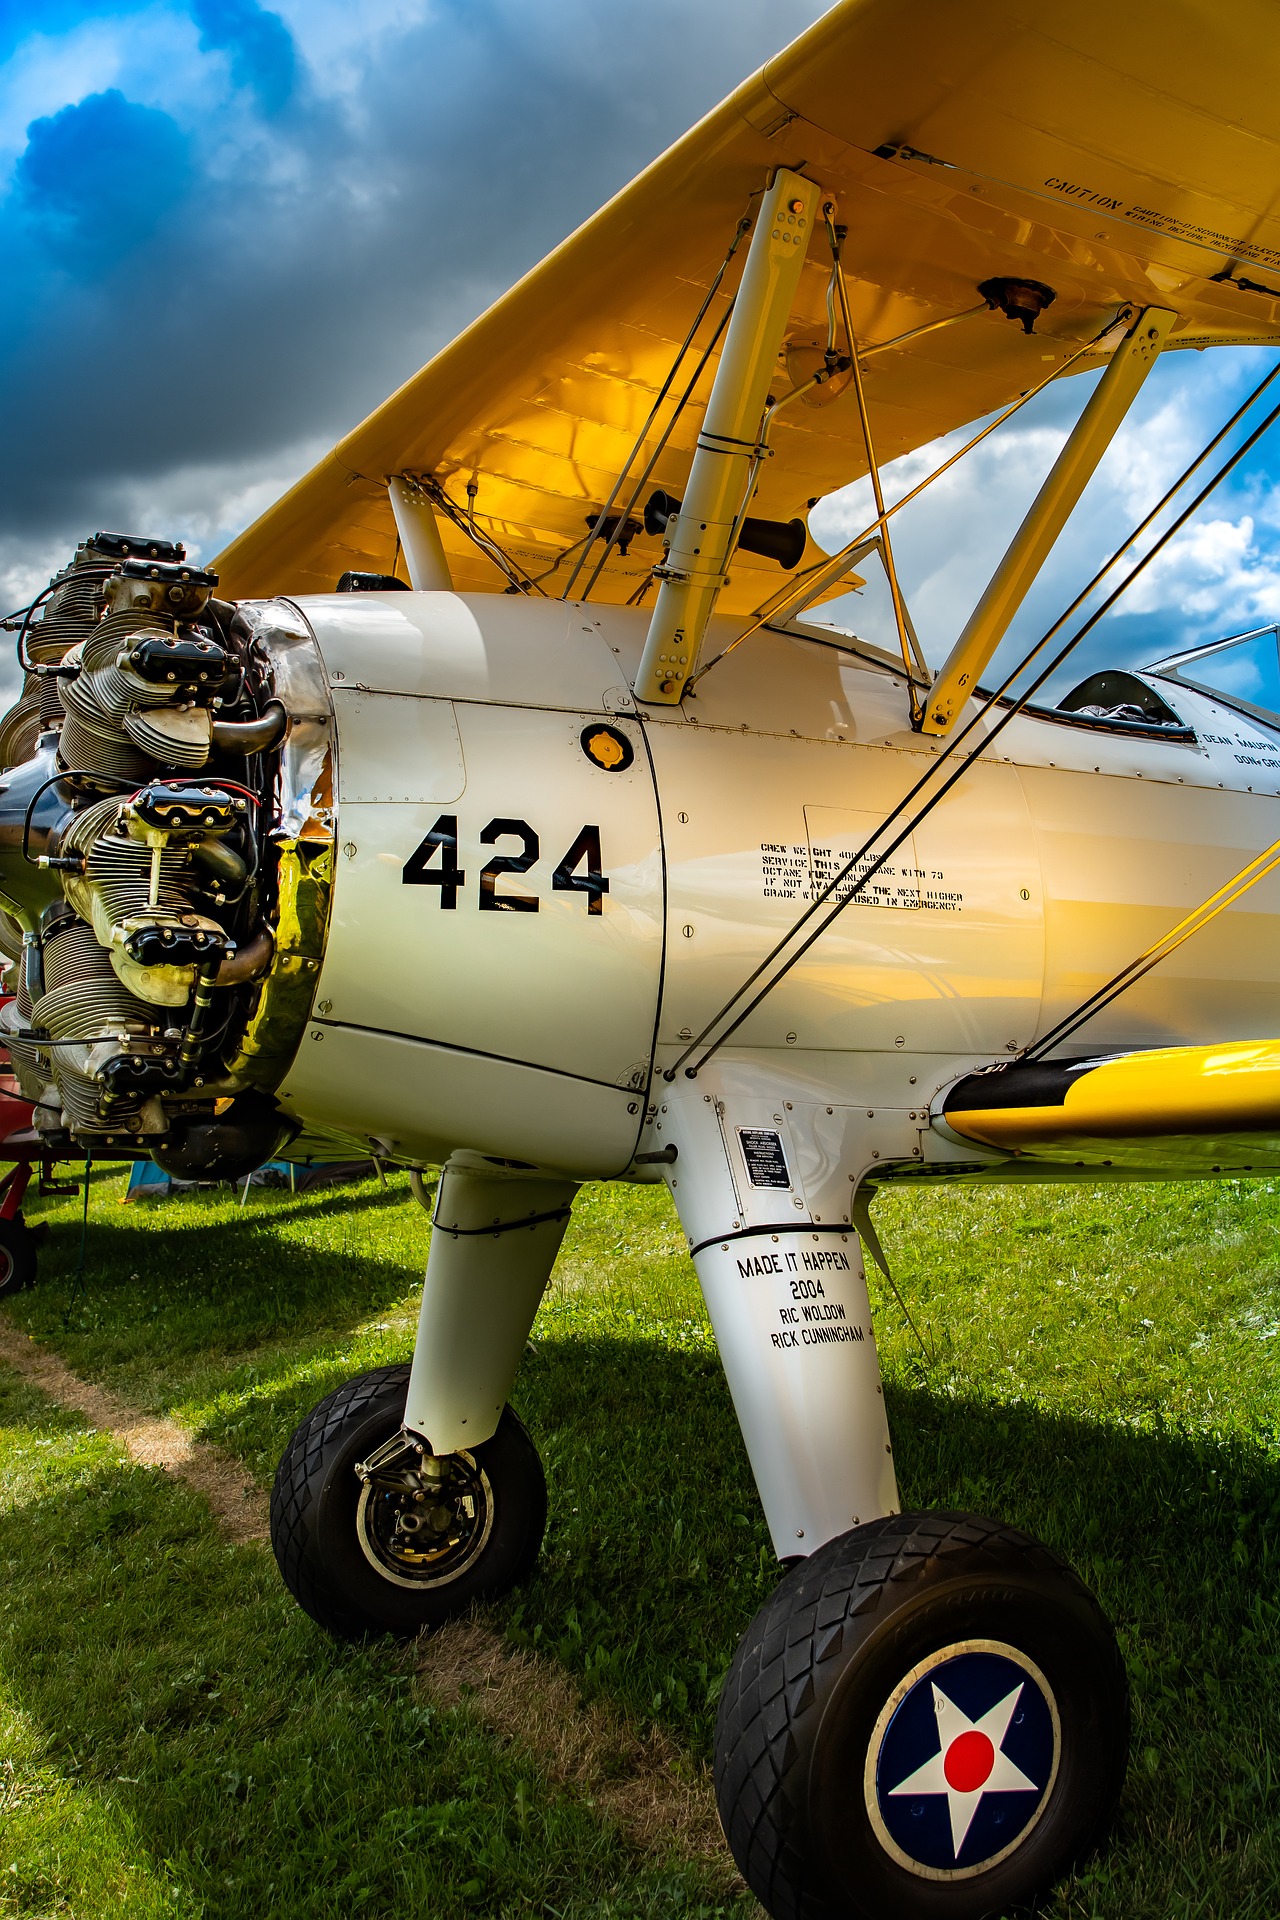
For example, this image is processed into three images:
A copy of the image with grid lines along which to cut:
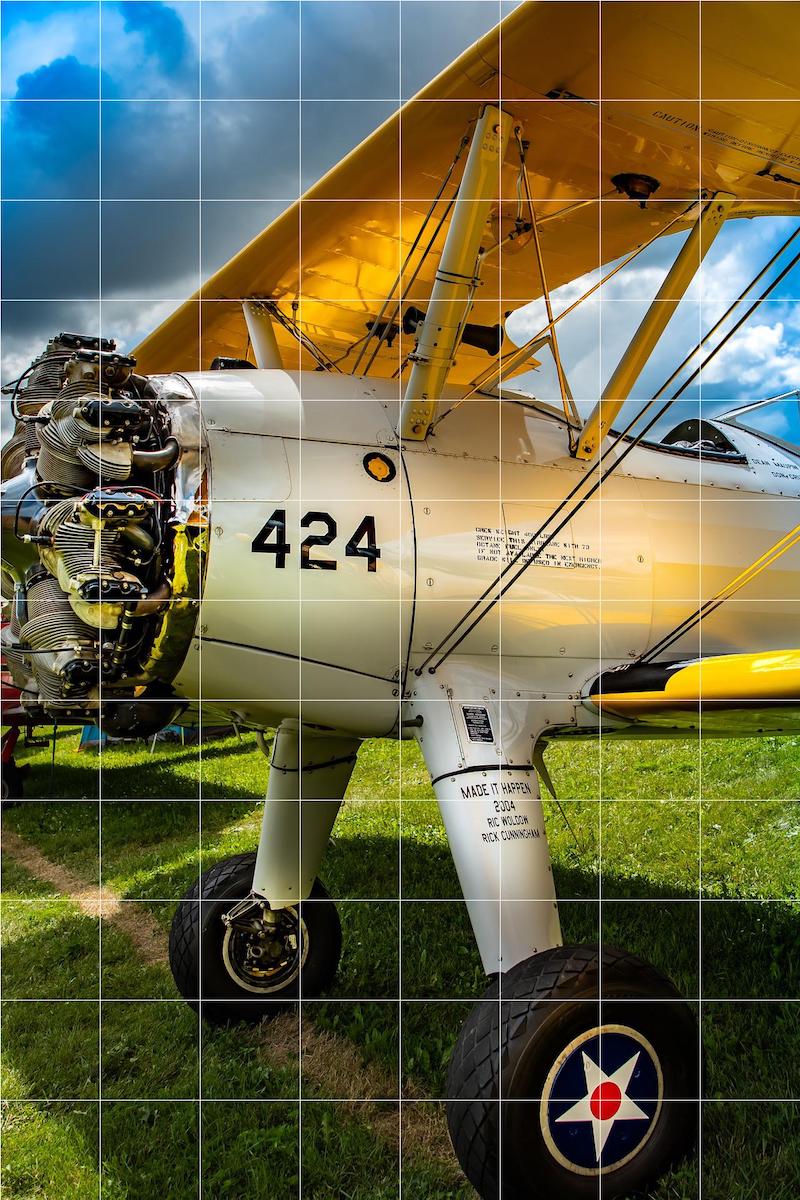
Image by Brent Connelly from Pixabay
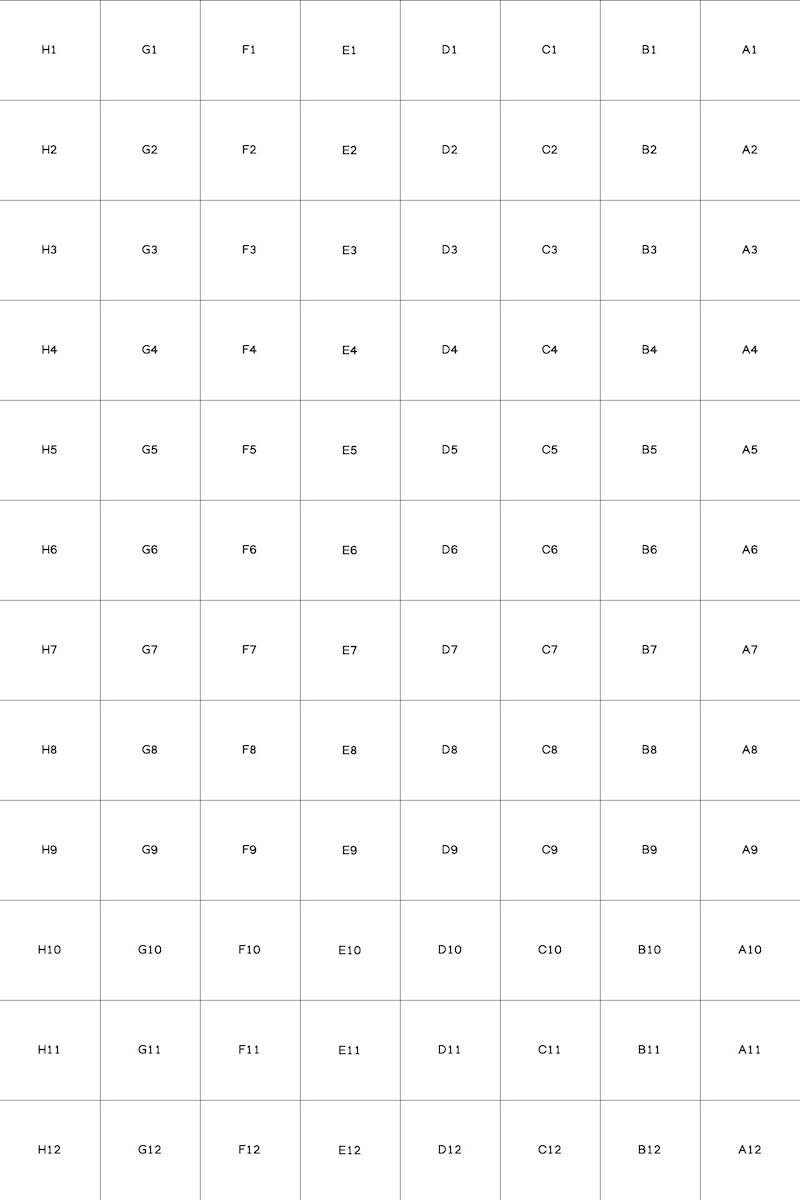
A grid with coordinate labels for the reverse side of the image:
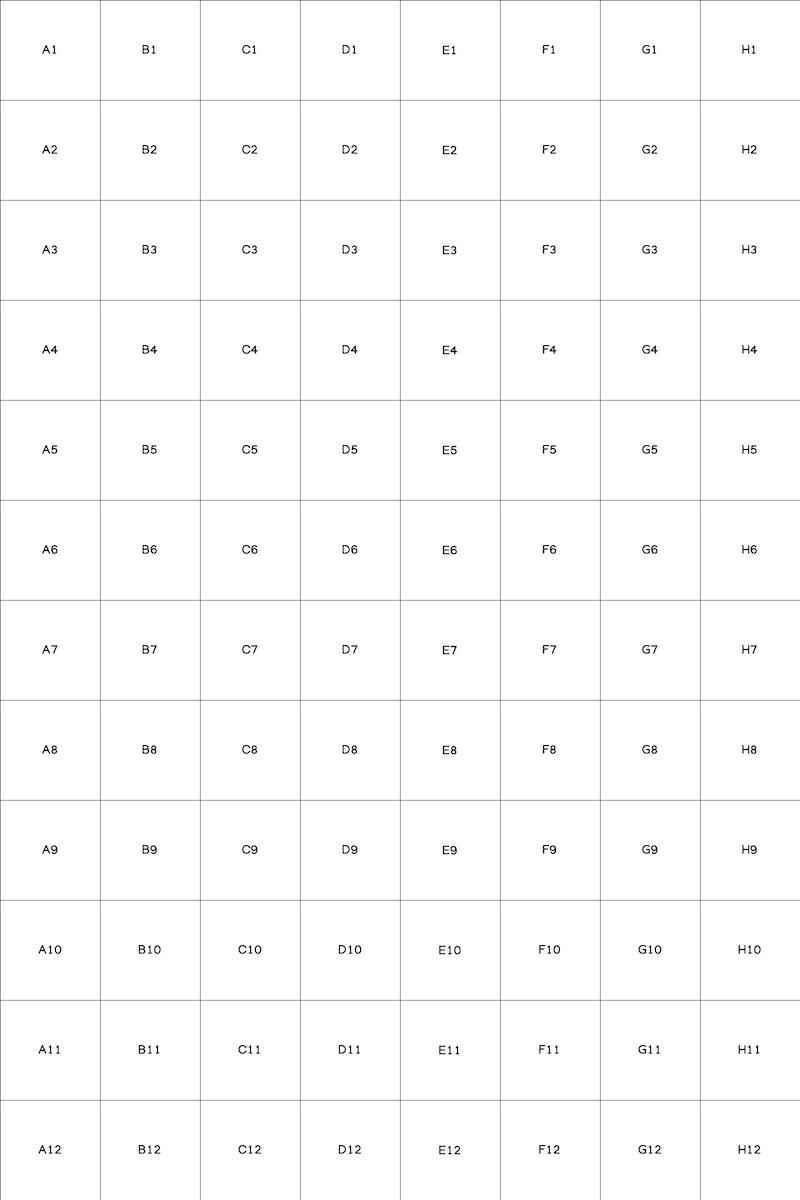
And a grid onto which the cut-out squares can be stuck:
All three images are provided in this single PDF file.
Command line usage is:
$python make-sticker-chart.py <image_name>
where image_name is the name of the image to use (it should be of reasonable resolution to print at e.g. A4). The size of the squares is determined, indirectly, by the parameter NW which is the number of squares along the width (x-dimension).
import os
import sys
from PIL import Image, ImageDraw, ImageFont

WHITE = (255, 255, 255)
BLACK = (0, 0, 0)
FONT_SIZE = 20
# Number of squares in width (x-) direction.
NW = 8
image_name = sys.argv[1]

im = Image.open(image_name)
print(im.format, im.size, im.mode)

def get_coords(i, j):
    """Return coordinate as 'A1', 'A2' etc. from i, j."""
    return '{}{}'.format(chr(65+i), j+1)

def get_offset(s, draw, font):
    """Return the offset to centre string s when anchored top left."""
    ox, oy = draw.textsize(s, font)
    return ox/2, oy/2

w, h = im.size
# Determine the square size, and number of squares in height (y-) direction.
nw = NW
dw = w / nw
nh = int(h / dw)
dh = h / nh

# New images for the grid and reversed grid (backside of the image).
im_grid = Image.new('RGB', (w, h), WHITE)
im_rgrid = Image.new('RGB', (w, h), WHITE)

# Get the font object in the requested size.
font = ImageFont.truetype("Manjari-Bold.ttf", FONT_SIZE)

draw = ImageDraw.Draw(im)
draw_grid = ImageDraw.Draw(im_grid)
draw_rgrid = ImageDraw.Draw(im_rgrid)

# Draw the grid lines and coordinate labels on the images.
for i in range(nw):
    # Vertical lines.
    draw.line((i*dw, 0) + (i*dw, h), fill=WHITE)
    draw_grid.line((i*dw, 0) + (i*dw, h), fill=BLACK)
    draw_rgrid.line((w-i*dw, 0) + (w-i*dw, h), fill=BLACK)

    # Coordinate labels: centre the text in each square.
    tx = (i+0.5)*dw
    for j in range(nh):
        ty = (j+0.5)*dh
        s = get_coords(i,j)
        ox, oy = get_offset(s, draw_grid, font)
        draw_grid.text((tx-ox,ty-oy), s, fill=BLACK, font=font)
        draw_rgrid.text((w-tx-ox,ty-oy), s, fill=BLACK, font=font)

# These are the horizontal lines.
for j in range(nh):
    draw.line((0, j*dh) + (w, j*dh), fill=WHITE)
    draw_grid.line((0, j*dh) + (w, j*dh), fill=BLACK)
    draw_rgrid.line((0, j*dh) + (w, j*dh), fill=BLACK)

# Save the lot as JPEG images and bundled together as a PDF.
stem_name = os.path.splitext(image_name)[0]
im.save(stem_name + '_gridded.jpg')
im_grid.save(stem_name + '_grid.jpg')
im_rgrid.save(stem_name + '_rgrid.jpg')

images = [im, im_rgrid, im_grid]
pdf_name = stem_name + '.pdf'
images[0].save(pdf_name, save_all=True, append_images=images[1:])