The world's nuclear reactors over time
Posted on 18 May 2018
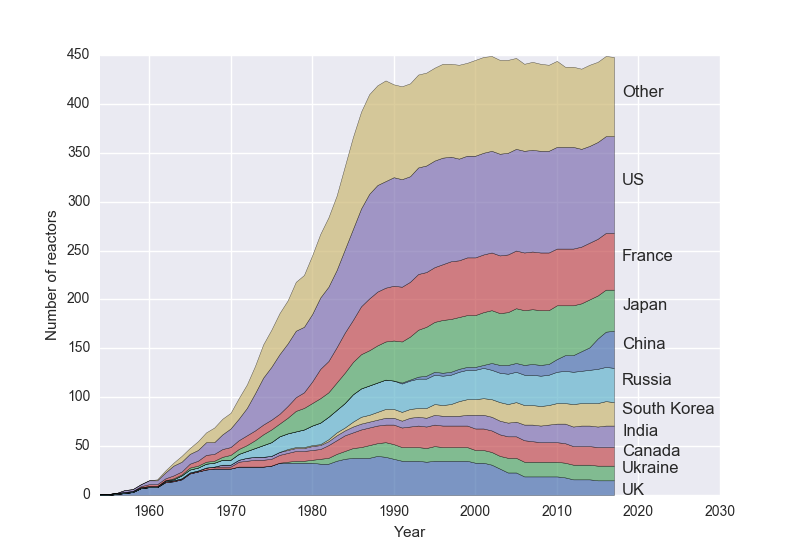
The Python program given below generates this stacked area plot of the number of nuclear reactors in different countries over the last six decades or so.
It requires the Pandas library and the data file reactors.csv.
import pandas as pd, numpy as np
import matplotlib.pyplot as plt
import seaborn as sbs
Series, DataFrame = pd.Series, pd.DataFrame

# Make a dictionary of country names by code
country_names = {'KR': 'South Korea', 'GB': 'UK', 'RU': 'Russia',
    'CN': 'China', 'FR': 'France', 'JP': 'Japan', 'IN': 'India',
    'CA': 'Canada', 'UA': 'Ukraine'}

# CSV file column names.
names = ['type', 'status', 'location', 'refpower', 'grosscap',
         'dateconnected', 'country_code', 'dateshutdown', 'datesuspended',
         'datereconnected', 'id', 'name'
        ]
# Read in data file and convert dates to the correct type.
df = pd.read_csv('reactors.csv', names=names, header=None)
df['dateconnected'] = pd.to_datetime(df['dateconnected'])
df['dateshutdown'] = pd.to_datetime(df['dateshutdown'])
country_codes = df.country_code.unique()

reactors = DataFrame(0,index=range(1953, 2018), columns=country_codes)
for c_code in country_codes:
    c_df = df[df['country_code']==c_code][['dateconnected','dateshutdown']]
    reactors['on'] = c_df.dateconnected.dt.year.value_counts().sort_index()
    reactors['off'] = c_df.dateshutdown.dt.year.value_counts().sort_index()
    reactors['on'] = reactors['on'].fillna(0)
    reactors['off'] = reactors['off'].fillna(0)
    reactors[c_code] = (reactors['on'] - reactors['off']).cumsum()
reactors = reactors.drop(columns=['off', 'on'])

# We will label the nmost countries with the most nuclear reactors.
nmost = 10
most_nuclear_countries = reactors.loc[2017].sort_values()[-nmost:].index
least_nuclear_countries = reactors.columns ^ most_nuclear_countries
# Add the a column for the sum of the other countries' reactors and drop their
# individual columns.
reactors['Other'] = reactors[least_nuclear_countries].sum(axis=1)
plt_reactors = reactors.drop(columns=least_nuclear_countries)
plt_reactors = reactors[most_nuclear_countries]
plt_reactors['Other'] = reactors[least_nuclear_countries].sum(axis=1)

fig, ax = plt.subplots()
ax.stackplot(plt_reactors.index,
             *[plt_reactors.loc[:,cc] for cc in plt_reactors.columns],
             alpha=0.7, labels=plt_reactors.columns)

reactors_2017 = plt_reactors.loc[2017].cumsum()
# Find out where to locate the country label and annotate the graph
y = reactors_2017.rolling(2).mean().fillna(0)
for i,cc in enumerate(plt_reactors.columns):
    try:
        country_name = country_names[cc]
    except KeyError:
        country_name = cc
    ax.annotate(country_name, xy=(2018, y[i]))

ax.set_xlim(1954, 2030)
ax.set_xlabel('Year')
ax.set_ylabel('Number of reactors')
plt.savefig('reactors_by_country.png')
plt.show()