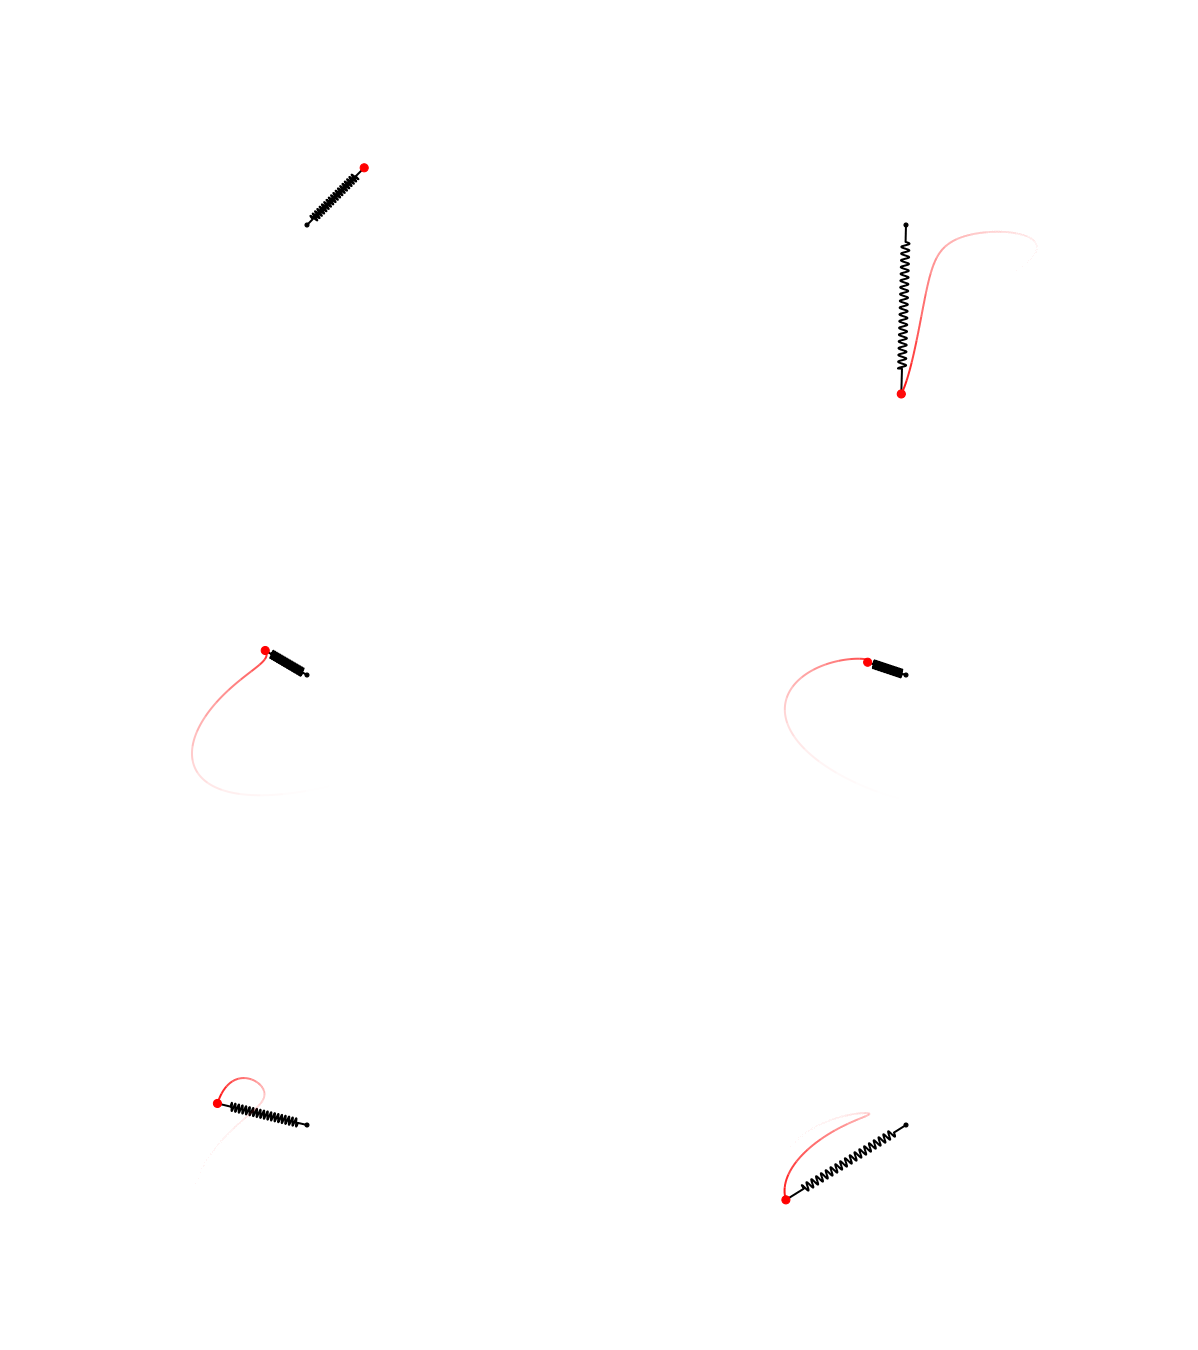
The spring pendulum
Posted on 19 July 2017
Following on from the previous post on the double pendulum, here is a similar Python script for plotting the behaviour of the "spring pendulum": a bob of mass $m$ suspended from a fixed anchor by a massless spring.

As before, the code places frames of the animation in a directory frames/ which can be turned into a gif with, for example, ImageMagick's convert utility. A derivation of the Lagrangian equations used is given under the code.
import numpy as np
from scipy.integrate import odeint
import matplotlib.pyplot as plt
from matplotlib.patches import Circle

# Pendulum equilibrium spring length (m), spring constant (N.m)
L0, k = 1, 40
m = 1
# The gravitational acceleration (m.s-2).
g = 9.81

def deriv(y, t, L0, k, m):
    """Return the first derivatives of y = theta, z1, L, z2."""
    theta, z1, L, z2 = y

    thetadot = z1
    z1dot = (-g*np.sin(theta) - 2*z1*z2) / L
    Ldot = z2
    z2dot = (m*L*z1**2 - k*(L-L0) + m*g*np.cos(theta)) / m
    return thetadot, z1dot, Ldot, z2dot

# Maximum time, time point spacings and the time grid (all in s).
tmax, dt = 20, 0.01
t = np.arange(0, tmax+dt, dt)
# Initial conditions: theta, dtheta/dt, L, dL/dt
y0 = [3*np.pi/4, 0, L0, 0]

# Do the numerical integration of the equations of motion
y = odeint(deriv, y0, t, args=(L0, k, m))
# Unpack z and theta as a function of time
theta, L = y[:,0], y[:,2]

# Convert to Cartesian coordinates of the two bob positions.
x = L * np.sin(theta)
y = -L * np.cos(theta)

# Plotted bob circle radius
r = 0.05
# Plot a trail of the m2 bob's position for the last trail_secs seconds.
trail_secs = 1
# This corresponds to max_trail time points.
max_trail = int(trail_secs / dt)

def plot_spring(x, y, theta, L):
    """Plot the spring from (0,0) to (x,y) as the projection of a helix."""
    # Spring turn radius, number of turns
    rs, ns = 0.05, 25
    # Number of data points for the helix
    Ns = 1000
    # We don't draw coils all the way to the end of the pendulum:
    # pad a bit from the anchor and from the bob by these number of points
    ipad1, ipad2 = 100, 150
    w = np.linspace(0, L, Ns)
    # Set up the helix along the x-axis ...
    xp = np.zeros(Ns)
    xp[ipad1:-ipad2] = rs * np.sin(2*np.pi * ns * w[ipad1:-ipad2] / L)
    # ... then rotate it to align with  the pendulum and plot.
    R = np.array([[np.cos(theta), -np.sin(theta)],
                  [np.sin(theta), np.cos(theta)]])
    xs, ys = - R @ np.vstack((xp, w))
    ax.plot(xs, ys, c='k', lw=2)

def make_plot(i):
    """
    Plot and save an image of the spring pendulum configuration for time
    point i.

    """

    plot_spring(x[i], y[i], theta[i], L[i])
    # Circles representing the anchor point of rod 1 and the bobs
    c0 = Circle((0, 0), r/2, fc='k', zorder=10)
    c1 = Circle((x[i], y[i]), r, fc='r', ec='r', zorder=10)
    ax.add_patch(c0)
    ax.add_patch(c1)

    # The trail will be divided into ns segments and plotted as a fading line.
    ns = 20
    s = max_trail // ns

    for j in range(ns):
        imin = i - (ns-j)*s
        if imin < 0:
            continue
        imax = imin + s + 1
        # The fading looks better if we square the fractional length along the
        # trail.
        alpha = (j/ns)**2
        ax.plot(x[imin:imax], y[imin:imax], c='r', solid_capstyle='butt',
                lw=2, alpha=alpha)

    # Centre the image on the fixed anchor point, and ensure the axes are equal
    ax.set_xlim(-np.max(L)-r, np.max(L)+r)
    ax.set_ylim(-np.max(L)-r, np.max(L)+r)
    ax.set_aspect('equal', adjustable='box')
    plt.axis('off')
    plt.savefig('frames/_img{:04d}.png'.format(i//di), dpi=72)
    # Clear the Axes ready for the next image.
    plt.cla()


# Make an image every di time points, corresponding to a frame rate of fps
# frames per second.
# Frame rate, s-1
fps = 10
di = int(1/fps/dt)
# This figure size (inches) and dpi give an image of 600x450 pixels.
fig = plt.figure(figsize=(8.33333333, 6.25), dpi=72)
ax = fig.add_subplot(111)

for i in range(0, t.size, di):
    print(i // di, '/', t.size // di)
    make_plot(i)
Derivation of the equations of motion
There are two degrees of freedom in this problem, which are taken to be the angle of the pendulum from the vertical and the total length of the spring. Let the origin be at the anchor with the $y$-axis pointing up and the $x$ axis pointing to the right. The spring is assumed to have a force constant $k$ and an equilibrium length $l_0$ such that its potential energy when extended or compressed to a length $l$ is $\frac{1}{2}k(l-l_0)^2$. The components of the bob's position and velocity are:
$$ \begin{align*} x &= l\sin\theta & \dot{x} &= \dot{l}\sin\theta + l\dot{\theta}\cos\theta\\ y &= -l\cos\theta & \dot{y} &= -\dot{l}\cos\theta + l\dot{\theta}\sin\theta \end{align*} $$
The potential and kinetic energies are therefore:
$$ \begin{align*} V &= mgy + \tfrac{1}{2}k(l-l_0)^2 = -mgl\cos\theta + \tfrac{1}{2}k(l-l_0)^2,\\ T &= \tfrac{1}{2}mv^2 = \tfrac{1}{2}m(\dot{x}^2 + \dot{y}^2) = \tfrac{1}{2}m(\dot{l}^2 + l^2\dot{\theta}^2), \end{align*} $$
and so the Lagrangian is $$ \mathcal{L} = \tfrac{1}{2}m(\dot{l}^2 + l^2\dot{\theta}^2) - \tfrac{1}{2}k(l-l_0)^2 + mgl\cos\theta. $$ Applying the Euler-Lagrange relations for $\theta$ and $l$ as before gives
$$ \begin{align*} 2\dot{l}\dot{\theta} + l\ddot{\theta} + g\sin\theta & = 0\\ m\ddot{l} - ml\dot{\theta}^2 + k(l-l_0) - mg\cos\theta &= 0. \end{align*} $$
To cast this pair of second-order differential equations into four first-order differential equations, let $z_1 = \dot{\theta}$ and $z_2 = \dot{l}$ to give
$$ \begin{align*} \dot{z}_1 &= -\frac{1}{l}[g\sin\theta + 2z_1z_2],\\ \dot{z}_2 &= \frac{1}{m}[mlz_1^2 - k(l-l_0) + mg\cos\theta]. \end{align*} $$
which are the relations that appear in the function deriv.