The separatrix for a simple pendulum
Posted on 29 September 2016
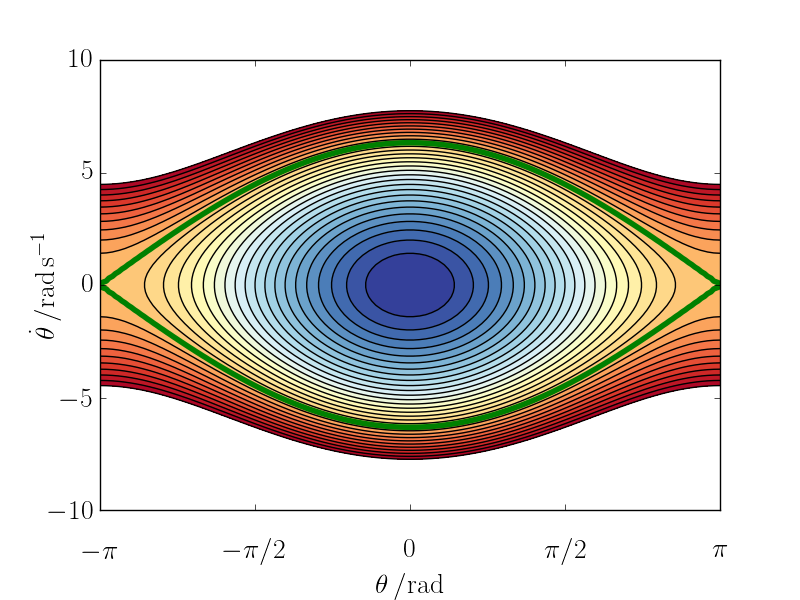
The Hamiltonian of a simple pendulum of mass $m$ and length $l$ may be written $$ \textstyle H = T + V = \frac{1}{2}ml^2\dot{\theta}^2 + mgl(1-\cos\theta) $$ Or, dividing by the moment of inertia, $I=ml^2$, $$ \textstyle H' = \frac{1}{2}\dot{\theta}^2 + \frac{g}{l}(1-\cos\theta) $$ Contours of constant $H$ in the phase space $(\theta, \dot{\theta})$ are plotted below, with the contour corresponding to the separatrix highlighted. This is the value of $H=2g/l$ corresponding to the boundary between two distinct kinds of motion: for $H$ less than this value, the pendulum swings back and forth (closed curves in phase space); for $H$ greater than this, the pendulum turns in continuous circles.
import numpy as np
import matplotlib.pyplot as plt
import matplotlib as mpl

# Some Matplotlib settings so the font is consistent
mpl.rc('font', **{'family': 'serif', 'serif': ['Computer Modern'],
                  'size': 20})
mpl.rc('text', usetex=True)

# Acceleration due to gravity, m.s-2
g = 10
# Length of pendulum, m
L = 1

# angle, angular velocity
theta = np.linspace(-np.pi, np.pi, 100)
theta_dot = np.linspace(-10, 10, 100)

# Calculate the Hamiltonian for the pendulum
Theta, Theta_dot = np.meshgrid(theta, theta_dot)
H = Theta_dot**2 / 2 + g/L * (1 - np.cos(Theta))

# Plot the figure
fig, ax = plt.subplots(figsize=(8,6))
# Make room for the x-axis label which would get clipped otherwise
fig.subplots_adjust(bottom=0.15)
# Contour levels from 0 to 3g/L
levels = np.linspace(0, 3*g/L, 31)
# The separatrix is the contour with H=2g/L
i_separatrix = np.where(levels==2*g/L)[0][0]
# Contours and filled contours
cs = plt.contour(theta, theta_dot, H, levels=levels, colors='k')
plt.contourf(theta, theta_dot, H, levels=levels, cmap=mpl.cm.RdYlBu_r)
# Highlight the separatrix, at H = g/L
cs.collections[i_separatrix].set_color('g')
cs.collections[i_separatrix].set_linewidth(4)

# Axis ticks and labels
ax.set_xlabel(r'$\theta\,/\mathrm{rad}$')
ax.set_xticks(np.linspace(-np.pi, np.pi, 5))
ax.set_xticklabels((r'$-\pi$', r'$-\pi/2$', '0',
                    r'$\pi/2$', r'$\pi$'))
ax.tick_params(axis='x', which='major', pad=20)
ax.set_ylabel(r'$\dot{\theta}\,/\mathrm{rad\,s^{-1}}$', labelpad=-10)

plt.show()