The Goldbach Comet
Posted on 22 March 2017
Goldbach's conjecture is probably one of the most famous unsolved problems in mathematics. It states that
Every even integer $n>2$ can be expressed as the sum of two primes.
The number of different ways that $n$ can be expressed as the sum of two primes is known as the Goldbach function, $g(n)$, and a plot of $g(n)$ against $n$ is called the Goldbach comet:
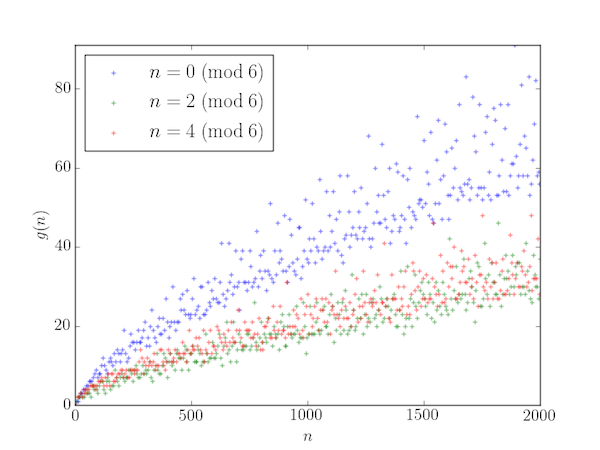
To explain the shape of this plot, first note that all prime numbers $p > 3$ are of the form $6q \pm 1$ ($q=1,2,\cdots$) (that is, $p \;\mathrm{mod}\;6$ is 1 or 5). To see this, write an arbitrary integer as $m=6q+r$: then if $r$ is 0, 2 or 4 then certainly $m$ is even and if $r$ is 3 then $m$ is divisible by 3. So if $m>3$ is prime it must be that case that $r$ is 1 or 5.
Now consider the possible ways of forming an even integer $n>6$ from two primes:
$$ \begin{align*} (6a-1) + (6b-1) &= 6(a+b) - 2 = 4\;(\mathrm{mod}\;6)\\ (6a-1) + (6b+1) &= 6(a+b) = 0\;(\mathrm{mod}\;6)\\ (6a+1) + (6b-1) &= 6(a+b) = 0\;(\mathrm{mod}\;6)\\ (6a+1) + (6b+1) &= 6(a+b) + 2 = 2\;(\mathrm{mod}\;6)\\ (6a-1) + 3 &= 6a + 2 = 2\;(\mathrm{mod}\;6)\\ (6a+1) + 3 &= 6a + 4 = 4\;(\mathrm{mod}\;6)\\ \end{align*} $$ That is, we can expect that there are more ways of creating an even integer equal to 0 (mod 6) from two primes (the blue points above) than there are of creating an even integer equal to 2 or 4 (mod 6) (the green and red points).
The Python code used to create the above plot is below.
This code is also available on my github page.
import numpy as np
import matplotlib.pyplot as plt

nmax = 2000
# Odd prime numbers up to nmax.
odd_primes = np.array([n for n in range(3, nmax) if all(
                        (n % m) != 0 for m in range(2,int(np.sqrt(n))+1))])

def get_g(n):
    """Return the value of the Goldbach function for even integer n>2."""
    g = 0
    for p in odd_primes:
        if p > n//2:
            break
        if n-p in odd_primes:
            g += 1
    return g

# Array of indexes into our Goldbach function array.
imax = nmax//2 - 1
idx = np.arange(imax)
def get_n_from_index(i):
    return 2*(i+2)
# The values of even n>2 from the index array.
n = get_n_from_index(np.arange(imax))

# Get an array of Goldbach function values corresponding to the n array.
g = np.zeros(imax, dtype=int)
for i in idx:
    g[i] = get_g(n[i])

# Indexes into the arrays for the cases n = 0, 2 or 4 (mod 6)
i_0 = idx[((n%6)==0)]
i_2 = idx[((n%6)==2)]
i_4 = idx[((n%6)==4)]

# Make the scatter plot for these three cases with different colour markers.
plt.scatter(n[i_0], g[i_0], marker='+', c='b', alpha=0.5,
            label=r'$n=0\;(\mathrm{mod}\;6)$')
plt.scatter(n[i_2], g[i_2], marker='+', c='g', alpha=0.5,
            label=r'$n=2\;(\mathrm{mod}\;6)$')
plt.scatter(n[i_4], g[i_4], marker='+', c='r', alpha=0.5,
            label=r'$n=4\;(\mathrm{mod}\;6)$')

# Set the plot limits and tidy.
plt.xlim(0, nmax)
plt.ylim(0, np.max(g[i_0]))
plt.xlabel(r'$n$')
plt.ylabel(r'$g(n)$')
plt.legend(loc='upper left', scatterpoints=1)
plt.savefig('goldbach_comet.png')
plt.show()