The Earth-Venus "dance"
Posted on 26 May 2016
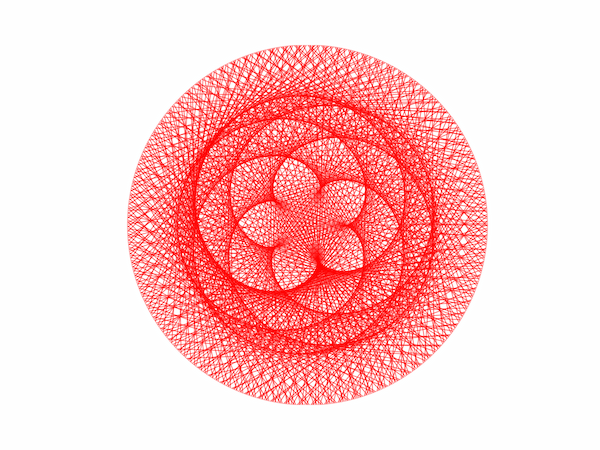
If you join the positions of Earth and Venus with a straight line and follow them as they orbit the sun, you get a nice picture that has been popular on Facebook. Here's the Python code for generating a similar diagram. The figure has the pleasing shape it does because the ratio of the planets' orbital periods is close to 13:8.
import numpy as np
import matplotlib.pyplot as plt

# Orbital radii (AU) and periods (Earth days) for Earth (e) and Venus (v).
re, rv, Te, Tv = 1, 0.72, 365.25, 224.7

# Number of Earth years to plot for and total number of positions to sample.
n, N = 9, 750

# Time grid and corresponding angular position of the two planets.
t = np.linspace(0, n*Te, N)
thetae = t * 2*np.pi / Te
thetav = t * 2*np.pi / Tv

# Polar to Cartesian conversion
xe, ye = re * np.cos(thetae), re * np.sin(thetae)
xv, yv = rv * np.cos(thetav), rv * np.sin(thetav)

for i in range(len(thetae)):
    plt.plot([xe[i], xv[i]], [ye[i], yv[i]], color='r', alpha=0.5)
plt.axis('equal')
plt.axis('off')
plt.show()
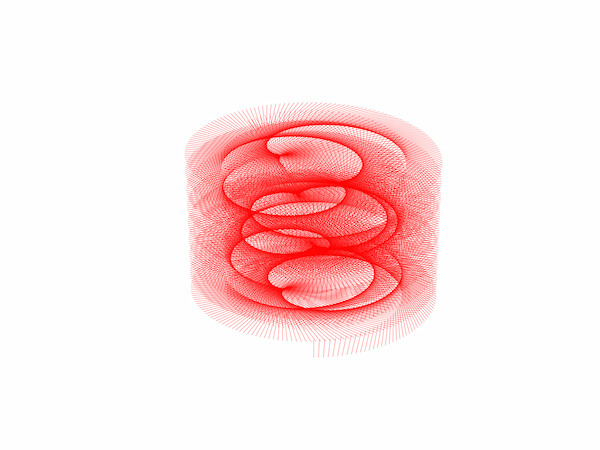
The Solar system is actually moving around the galaxy and its motion for short time periods may be considered to be linear. We can use Matplotlib to plot the above figure in three dimensions as follows.
import numpy as np
import matplotlib.pyplot as plt
from mpl_toolkits.mplot3d import Axes3D

fig = plt.figure()
ax = fig.add_subplot(111, projection='3d')

# Number of years, total number of points.
n, N = 9, 1500
# Orbital radii (AU) and periods (Earth days) for Earth and Venus.
re, rv, Te, Tv = 1, 0.72, 365.25, 224.7
# Orbital speed of sun (AU.dy-1) around galactic centre.
vs = 5.775e-4
t = np.linspace(0, n*Te, N)


# NB assume the solar system moves in a straight line: ie a short arc of its
# journey around the galaxy.
zs = t * vs
thetae = t * 2*np.pi / Te
thetav = t * 2*np.pi / Tv

# Polar to Cartesian conversion
xe, ye = re * np.cos(thetae), re * np.sin(thetae)
xv, yv = rv * np.cos(thetav), rv * np.sin(thetav)

for i in range(N):
    ax.plot([xe[i], xv[i]], [ye[i], yv[i]], [zs[i], zs[i]], color='r',
            alpha=0.5, lw=0.5)

# Set up the view orientation and turn off the axis planes.
ax.view_init(36, 0)
ax.set_axis_off()
plt.show()