Rotating text onto a line in Matplotlib
Posted on 03 September 2018
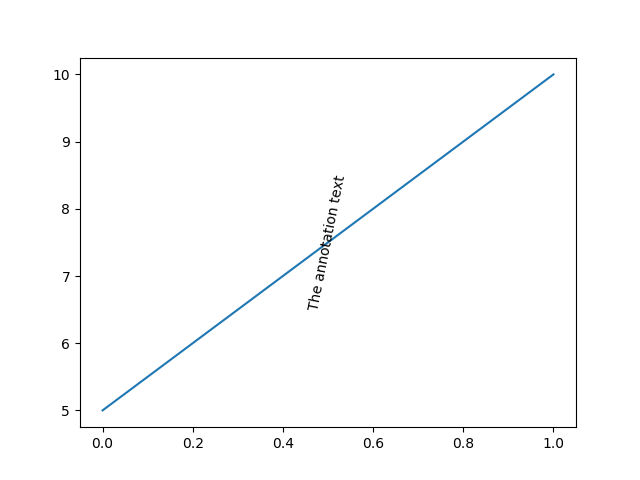
Sometimes it is necessary to rotate a text annotation in a Matplotlib figure so that it is aligned with a line plotted on the figure Axes. Axes.annotation takes an argument, rotation, to allow a text label to be rotated, and a naive implementation might be as follows:
import numpy as np
import matplotlib.pyplot as plt

x,y = np.array(((0,1),(5,10)))
fig, ax = plt.subplots()
ax.plot(x,y)

xylabel = ((x[0]+x[1])/2, (y[0]+y[1])/2)

dx, dy = x[1] - x[0], y[1] - y[0]
rotn = np.degrees(np.arctan2(dy, dx))
label = 'The annotation text'
ax.annotate(label, xy=xylabel, ha='center', va='center', rotation=rotn)

plt.show()
That is, calculated the angle of the line from its slope and rotate by that amount in degrees:

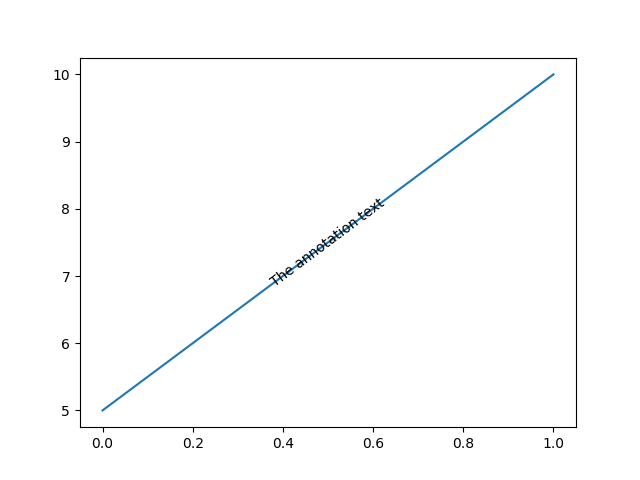
This fails because the rotation is carried out in the coordinate frame of the displayed figure, not the coordinate frame of the data. To make the text colinear with the plotted line, we need to transform from the latter to the former. The Matplotlib documentation has a brief tutorial on transformations. We therefore use ax.transData.transform_point to convert from the data coordinates to the display coordinates:
plt.clf()
fig, ax = plt.subplots()
ax.plot(x,y)
p1 = ax.transData.transform_point((x[0], y[0]))
p2 = ax.transData.transform_point((x[1], y[1]))
dy = (p2[1] - p1[1])
dx = (p2[0] - p1[0])
rotn = np.degrees(np.arctan2(dy, dx))
ax.annotate(label, xy=xylabel, ha='center', va='center', rotation=rotn)

plt.show()
