Packing circles inside a shape
Posted on 05 June 2019
A previous blog post dealt with packing circles into a circle. To fill an arbitrary shape, a slightly different approach is needed. The code is presented in my github repo.
A black-and-white PNG image should provided (the black areas to be filled). The ShapeFill class is initialized with its filename, the number of circles (n), and rho_min and rho_max, the ratios of the minimum and maximum circle size to the shortest dimension of the image (defaults are used if these parameters are not provided).
The colours are set at random from a sequence of indexes into a list of CSS-style colour specifiers. Not all the colours need to be set in a single pass through the make_circles algorithm in building an image, but they should all be sent to the ShapeFill constructor in order to set the CSS styles correctly.
# Land colours, sea colours.
c1 = ['#b6950c', '#9d150b']
c2 = ['#173f5f', '#20639b', '#3caea3']
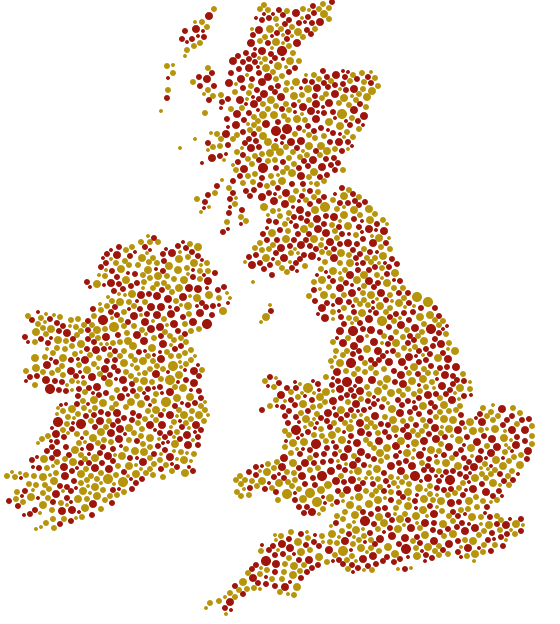
# First fill the land silhouette.
shape = ShapeFill('uk.png', n=3000, rho_max=0.01, colours=c1+c2)
shape.guard = 1000
shape.make_circles(c_idx=range(len(c1)))
shape.make_svg('uk-1.svg')
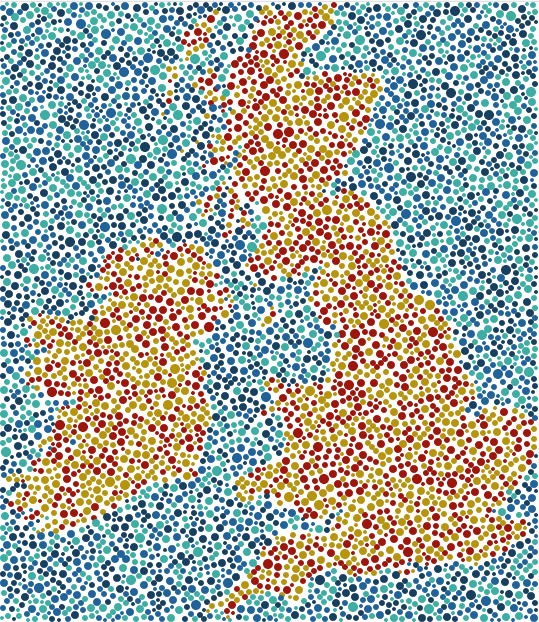
We can then go round again and pass another image (e.g. the inverse of the original image, to fill in the background):
# Now load the image again, invert it and fill the sea with circles.
shape.read_image('uk.png')
shape.img = 255 - shape.img
shape.n = 5000
shape.make_circles(c_idx=[len(c1)+i for i in range(len(c2))])
shape.make_svg('uk-2.svg')