Making a map out of dots
Posted on 12 April 2024
The code below generates stylised maps with land regions depicted by spaced markers (circles, polygons, etc). It requires the Python library, global-land-mask:
pip install global-land-mask
To create images, use the below DotMap class as follows:
from dotmap import DotMap
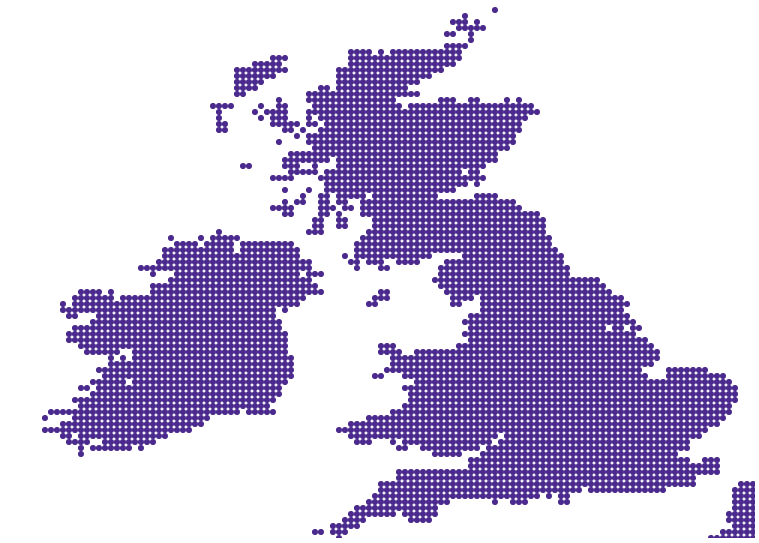
# British Isles
dot_map = DotMap(lat_range=(50, 60),
lon_range=(-12, 2),
d=20, r=6
)
dot_map.stroke = '#4b2a8e'
dot_map.fill = '#4b2a8e'
dot_map.make_svg("uk-20.svg", marker='o')
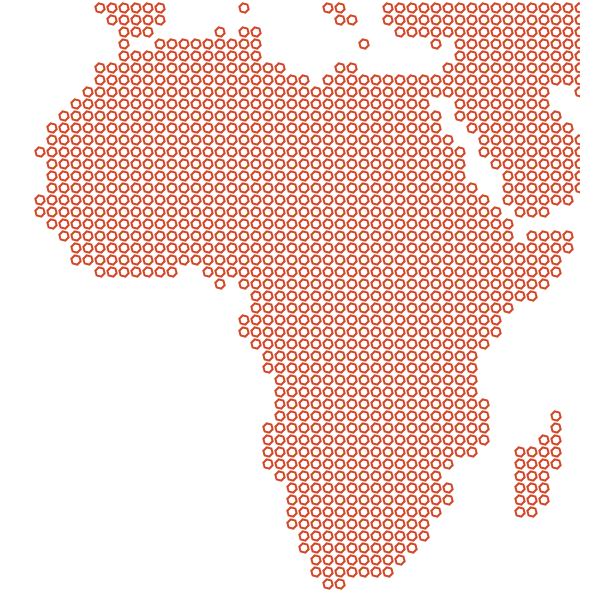
# Africa
dot_map = DotMap(width=600,
                 lat_range=(-45, 40),
                 lon_range=(-24, 52),
                 d=12)
dot_map.fill = "none"
dot_map.stroke = '#d44627'
dot_map.make_svg("africa-12.svg", marker='p_6_15')
The DotMap class is defined in the file dotmap.py:
import re
from functools import partial
import numpy as np
import matplotlib.pyplot as plt
from global_land_mask import globe

class DotMap:
    """A class to create a map in "dots"."""

    def __init__(self, width=800, lat_range=None, lon_range=None,
                 d=None, r=None):
        """
        Initialize the DotMap instance with the SVG image width (px),
        latitude range (-90 to 90 degrees), longitude range (-180 to 180 degrees),
        marker spacing and marker size (radius, in the case of circles), both in px.
        """

        if lat_range is None:
            lat_range = -90, 90
        if lon_range is None:
            lon_range = -180, 180
        self.lat_min, self.lat_max = lat_range
        self.lon_min, self.lon_max = lon_range

        self.width = width
        if d is None:
            # Default marker spacing.
            self.d = width / 100
        else:
            self.d = d
        if r is None:
            # Default marker size.
            self.r = self.d * 0.4
        else:
            self.r = r

        # Latitude and longitude ranges, degrees.
        self.Dlat = self.lat_max - self.lat_min
        self.Dlon = self.lon_max - self.lon_min
        # Calculate the height of the SVG image (px).
        self.height = int(self.width * self.Dlat / self.Dlon)
        # Number of maker sites along each axis.
        self.Nx = int(self.width / self.d + 1)
        self.Ny = int(self.height / self.d + 1)
        # Latitude and longitude spacings, degrees.
        self.dlat = self.Dlat / (self.Ny - 1)
        self.dlon = self.Dlon / (self.Nx - 1)

        # Default SVG marker styles.
        self.fill = "black"
        self.stroke = "black"
        self.stroke_width = "2px"

    def circle_at(self, ix, iy):
        """Circle marker."""
        cx, cy= ix * self.d, self.height - iy* self.d
        return f'<circle cx="{cx}" cy="{cy}" r="{self.r}"/>'

    def poly_at(self, ix, iy, nvert=6, phase=0):
        """Polygon marker with nvert vertices, rotated by phase degrees."""
        # Convert phase from degrees to radians.
        phase = np.radians(phase)
        cx, cy= ix * self.d, self.height - iy* self.d
        dtheta = 2 * np.pi / nvert
        points = []
        for j in range(nvert):
            theta = j * dtheta
            vx = cx + self.r * np.cos(theta + phase)
            vy = cy + self.r * np.sin(theta + phase)
            points.append(f"{vx}, {vy}")
        points = " ".join(points)
        return f'<polygon points="{points}"/>'

    def make_svg(self, filename="dot-map.svg", marker='o'):
        """Make the SVG image and save as filename.

        Available markers are:
        'o': circle
        'h': hexagon
        '^': up-triangle
        'v': down-triangle
        'p_<NVERT>_<PHASE>': polygon with <NVERT> vertices, rotated by <PHASE> degrees

        """

        poly_patt = r'p_(\d+)_(\d+)'
        if marker == 'o':
            marker_at = self.circle_at
        elif marker == 'h':
            marker_at = self.poly_at
        elif marker == 's':
            marker_at = partial(self.poly_at, nvert=4, phase=45)
        elif marker == '^':
            marker_at = partial(self.poly_at, nvert=3, phase=30)
        elif marker == 'v':
            marker_at = partial(self.poly_at, nvert=3, phase=90)
        elif m := re.match(poly_patt, marker):
            nvert = int(m.group(1))
            phase = float(m.group(2))
            marker_at = partial(self.poly_at, nvert=nvert, phase=phase)
        else:
            raise ValueError(f"Unrecognised marker: {marker}")

        # SVG preamble including marker styles.
        svg = [ '<?xml version="1.0" encoding="utf-8"?>',
                '<svg xmlns="http://www.w3.org/2000/svg"',
               f'     xmlns:xlink="http://www.w3.org/1999/xlink" '
               f'width="{self.width}" height="{self.height}" >\n',
                '<defs>\n    <style type="text/css"><![CDATA[',
               f'        circle {{stroke: {self.stroke}; fill: {self.fill};'
               f' stroke-width: {self.stroke_width};}}'
               f'        polygon {{stroke: {self.stroke}; fill: {self.fill};'
               f' stroke-width: {self.stroke_width};}}'
                ']]>\n    </style>\n</defs>'
              ]

        for iy in range(self.Ny):
            lat = self.lat_min + iy * self.dlat
            for ix in range(self.Nx):
                lon = self.lon_min + ix * self.dlon
                if globe.is_land(lat, lon):
                    svg.append(marker_at(ix, iy))

        svg.append('</svg>')

        print(f"Writing SVG file {filename}")
        with open(filename, 'w') as fo:
            print('\n'.join(svg), file=fo)
Some more usage examples:
# Europe
dot_map = DotMap(lat_range=(30, 70), lon_range=(-10, 20), d=4)
dot_map.stroke_width = '1px'
dot_map.make_svg("europe-4.svg", marker='o')

# World (without Antarctica)
dot_map = DotMap(lat_range=(-60, 90), d=12)
dot_map.stroke_width = '1px'
dot_map.make_svg("world-12.svg", marker='o')