Illustrating the Padovan sequence
Posted on 08 April 2020
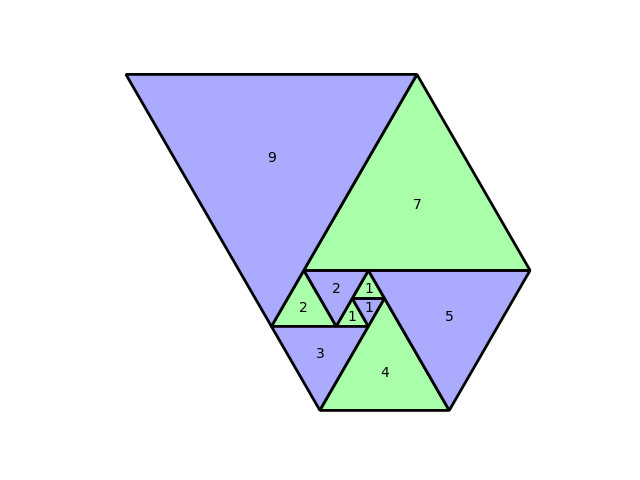
The Padovan sequence is a cousin of the more famous Fibonacci sequence defined by the initial values $P(1)=P(2)=P(3)=1$ and the recurrence relation $P(n) = P(n-2) + P(n-3)$. That is, the next value is obtained not by summing the previous two values but by summing the two values before the last one. The first few values are:
1, 1, 1, 2, 2, 3, 4, 5, 7, 9, 12, 16, 21, 28, 37
Just as the Fibonacci numbers can be visualised as a series of neighbouring squares of increasing size, there is a nice visualization of the Padovan sequence as a series of adjoining equilateral triangles. The following Python code produces this image:
import numpy as np
import matplotlib.pyplot as plt
from matplotlib.patches import Polygon

NMAX = 10
# Alternate triangles are coloured according to this scheme:
COLOURS = ('#aaffaa', '#aaaaff')

# The first NMAX Padovan numbers are kept in the list P.
P = [1, 1, 1, 2]
for i in range(4, NMAX):
    P.append(P[i-2] + P[i-3])
print(P)

def get_vertex(p1, p2):
    """Given two vertices of a triangle, return the third."""

    # Consider the first two points to define a vector from the first to the
    # second vertex. The third point is then obtained by rotating this vector
    # by 120 degrees and adding it to the second.
    c, s= -0.5, np.sqrt(3)/2
    R = np.array(((c, -s), (s, c)))
    v = p2 - p1
    return p2 + R @ v

# Hard code the first few vertices.
V0, V1 = np.array((0, 0)), np.array((1, 0))
V2 = get_vertex(V0, V1)
V3 = get_vertex(V2, V1)
V4 = get_vertex(V2, V3)
V5 = get_vertex(V0, V4)
V6 = get_vertex(V0, V5)
V7 = get_vertex(V1, V6)
T = np.empty((10, 3, 2))
T[:6] = [ (V0, V1, V2), (V2, V1, V3), (V2, V3, V4), (V0, V4, V5), (V0, V5, V6),
          (V1, V6, V7) ]

# The remaining triangles' vertices are given by recursion.
for i in range(6, NMAX):
    V0, V1 = T[i-4][1], T[i-1][2]
    T[i] = (V0, V1, get_vertex(V0, V1))

fig, ax = plt.subplots()
# Set the limits appropriately, turn off the axis and make sure it is in the
# right proportions so that our triangles look equilateral.
ax.axis('equal')
xmax = np.max(T[:,:,0])
xmin = np.min(T[:,:,0])
ymax = np.max(T[:,:,1])
ymin = np.min(T[:,:,1])
ax.set_xlim(xmin, xmax)
ax.set_ylim(ymin, ymax)
ax.axis('off')

def draw_triangle(triangle, colour):
    """Draw a triangle with provided vertices and face colour onto the axes."""
    v0, v1, v2 = triangle
    poly = Polygon((v0, v1, v2), fc=colour, ec='k', lw=2, joinstyle='bevel')
    ax.add_patch(poly)

# Draw the triangles, annotating with the side length (the Padovan sequence).
for i in range(len(T)):
    colour = COLOURS[i % 2]
    draw_triangle(T[i], colour)
    ax.annotate(str(P[i]), np.mean(T[i], axis=0), va='center', ha='center')
plt.show()