Highlighting a country on a Cartopy map
Posted on 26 February 2025
Cartopy is a Python package for geospatial data processing, map production and other geospatial data analyses.
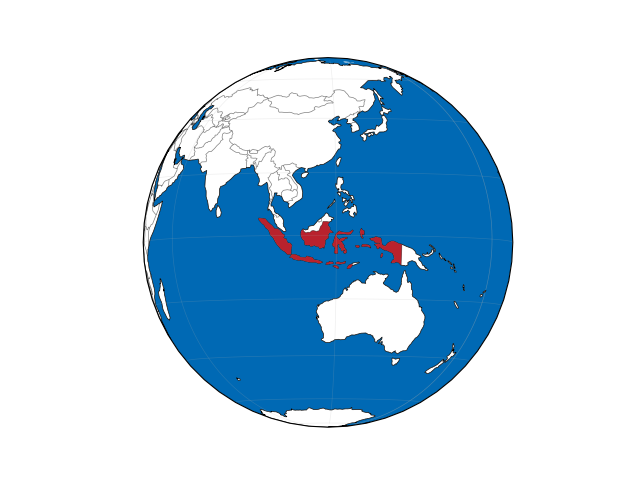
The short script below plots a map of the world using an orthographic projection and highlights a specified country. For example:
python highlight-country.py Indonesia
import sys
import numpy as np
import matplotlib.pyplot as plt
import pandas as pd
import geopandas
from cartopy.io import shapereader
import cartopy.crs as ccrs
import cartopy.feature as cfeature

OCEAN_COLOUR = (0, 105/255, 180/255)
HIGHLIGHT_COLOUR = (185/255, 34/255, 45/255)

highlighted_country = sys.argv[1]

# get country borders: read the shapefile using geopandas
url = "ne_110m_admin_0_countries.zip"
world = geopandas.read_file(url)
centroids = world.to_crs('+proj=cea').centroid.to_crs(world.crs)
centroids.index = world['NAME']
centroid = centroids[highlighted_country]

fig = plt.figure()
ax = fig.add_subplot(1, 1, 1, projection=ccrs.Orthographic(centroid.x, centroid.y))

ax.add_feature(cfeature.BORDERS, linestyle='-', alpha=0.5, lw=0.5)
ax.add_feature(cfeature.OCEAN, zorder=0, facecolor=OCEAN_COLOUR)
ax.add_feature(cfeature.LAND, zorder=0, edgecolor='black', facecolor=(1, 1, 1), lw=0.5)

poly = world.loc[world['ADMIN'] == highlighted_country]['geometry'].values[0]
ax.add_geometries(poly, crs=ccrs.PlateCarree(), facecolor=HIGHLIGHT_COLOUR, edgecolor='none', zorder=1)

ax.set_global()
ax.gridlines(lw=0.5, alpha=0.2)

plt.show()