Hidden images in spectrograms
Posted on 19 March 2016
It is well-known that Aphex Twin incorporated images in the spectrogram of the final few seconds of a couple of tracks from the Windowlicker EP.
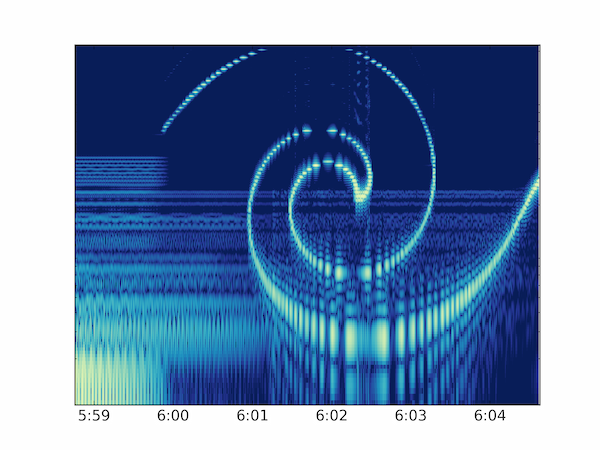
The title track has a spiral in the spectrogram at about the 6 minute mark. After reading in the file with scipy.io.wavfile (legally locating a WAV file version of Windowlicker is left as an exercise for the reader), we can extract the appropriate region and send it to the SciPy routine scipy.signal.spectrogram. The appropriate parameters to set in this function call are found a bit by trial and error. I chose a time segment size of nperseg=512 and a FFT size for each segment of nfft=4096 (otherwise the lower frequency components look "blocky" on a log scale).
The spectrogram image is plotted with pyplot.pcolormesh using a logarithmic colour-mapping. There's a fair amount of noise in the lower values of the power spectral density, so I set the minimum (vmin) to five orders of magnitude below the maximum which is above the noise.
Matplotlib does have a specgram function for plotting spectrograms directly, but at the time of writing it uses imshow to display the image and this does not allow for the logarithmic frequency axis necessary to view the undistorted images.
import numpy as np
import scipy.io.wavfile as wav
from scipy.signal import spectrogram
import matplotlib.pyplot as plt
from matplotlib.colors import LogNorm
from matplotlib.ticker import FuncFormatter

samplerate, samples = wav.read('windowlicker.wav')

# the image appears between time points t1 and t2 (secs)
t1, t2 = 358.76, 364.63
# determine the corresponding indexes into the samples array
i1, i2 = int(t1 * samplerate), int(t2 * samplerate)
# calculate the spectrogram, Sxx, of the sum of the left and right channels
f, t, Sxx = spectrogram(np.sum(samples[i1:i2,:], axis=1),
                        samplerate, nperseg=512, nfft=4096)
vmax = Sxx.max()
vmin = vmax / 1.e5
plt.pcolormesh(t1 + t, f, Sxx, norm=LogNorm(vmin=vmin, vmax=vmax),
               cmap='YlGnBu_r')

ax = plt.gca()
ax.set_yscale('log')
ax.set_ylim(100, 22000)
ax.set_yticks([])

def seconds_to_minsec(t, pos):
    return '{:d}:{:02d}'.format(int(t // 60), int(t % 60))

xtick_formatter = FuncFormatter(seconds_to_minsec)
ax.xaxis.set_major_formatter(xtick_formatter)

ax.set_xlim(t1, t2)
plt.show()
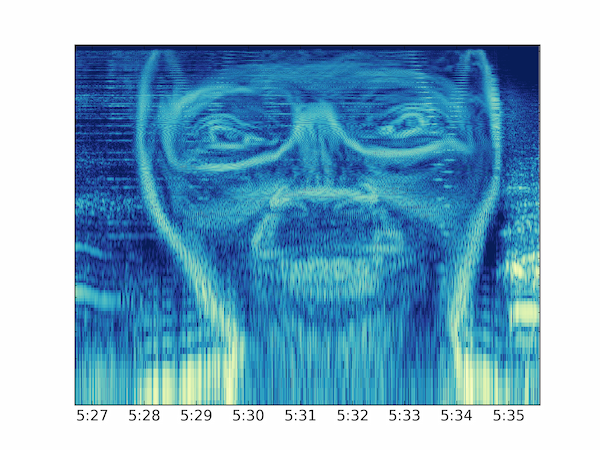
Track 2 on the same EP, Formula, also contains a hidden image (Richard D. James' face) in its spectrogram between $t$ = 326.67 and 335.60 secs.