Disasters in Great Britain and Ireland over time
Posted on 07 March 2017
Wikipedia has an interesting (if somewhat morbid) list of disasters in Great Britain and Ireland. This blog post will show how to scrape it and plot a chart of the deaths due to these disasters over time.
The list is divided into three sections: a table of "Over 200 fatalities", a bulleted list of "100-199 fatalities" and another of "Fewer than 100 fatalities". The largest death toll is 3,500,000 (the Black Death) and the smallest is 31. Presumably events which cause the deaths of fewer than this number of people are not considered "disasters" by the author. Acts of war are explicitly excluded from consideration here.
First, let's read in a local copy of the page's HTML so we don't have to keep hitting Wikipedia for it as we work:
import urllib.request

base_url = 'https://en.wikipedia.org/wiki/'
page = 'List_of_disasters_in_Great_Britain_and_Ireland_by_death_toll'
url = base_url + page
req = urllib.request.urlopen(url)
article = req.read().decode()

with open('List_of_disasters_in_Great_Britain_and_Ireland_by_death_toll.html',
          'w') as fo:
    fo.write(article)
Now to scrape the table of deaths with over 200 fatalities. A look at the page source shows that this is the only table with the class 'sortable', so we can find it easily enough with BeautifulSoup. We'd like the text for the event name, link, year and number of deaths. We can foresee some problems parsing this text, so let's output it and see what we need to do:
from bs4 import BeautifulSoup

article = open('List_of_disasters_in_Great_Britain_and_Ireland_by_death'
               '_toll.html').read()

soup = BeautifulSoup(article, 'html.parser')

# The data we want for the major disasters are in the only sortable table
# on the page.
table = soup.find_all('table', class_='sortable')[0]
for i, row in enumerate(table.find_all('tr')[1:]):
    cells = row.find_all('td')
    deaths_cell, event_cell, date_cell = cells[:3]
    deaths = deaths_cell.text
    event = event_cell.text
    date = date_cell.text
    print('<{}>:: {} :: {} :: {} ::'.format(i, deaths, event, date))
    event_link = event_cell.find_all('a')
    nlinks = len(event_link)
    if nlinks == 0:
        event_link = None
    elif nlinks == 1:
        event_link = event_link[0]['href']
    else:
        print('More than one link in event cell for', event)
The output starts:
<0>:: 3,500,000 :: Black Death pandemic :: 1347–1350 ::
More than one link in event cell for Black Death pandemic
<1>:: 1,000,000[1] to 1,500,000 :: Great Irish Famine :: 1845–1849 ::
<2>:: 225,000 :: Spanish flu pandemic :: 1918 (Sep–Nov) ::
<3>:: 100,000 :: Great Irish Famine (18th century) :: 1740–1741 ::
...
<116>:: 205 :: HMS Iolaire :: 1919 (1 January) ::
<117>:: 205 :: SS Hungarian :: 1860 (20 February) ::
We can immediately see an opportunity for some data-cleaning here
- We need to get read of the citation placeholders (numbers in square brackets).
- We'd like the death tolls as integers; where a number range is given, we can take the mean.
- If the number is given as a lower estimate, for example
'4,000+', we'll use that estimate. - From the date text, we're only interested in the year and again can take a mean where a range is given.
- One event's date is given as
'1970s–1980s': we can convert this to'1975–1985'before taking the mean. - In the absence of any further information we simply strip the
'ff.'from any open-ended events. - Some event links are invitations to the reader to edit or create a page on the event: these have
redlink=1in the URL and can be skipped. - There are four events for which more than one link is given in the event cell: in three of these we need the first link in the cell; we'll just skip the one on the Dumfries cholera outbreak (which links to the wikipedia page for the town, not the disaster itself).
Here's where we're at now:
read_table.py:
import re
from bs4 import BeautifulSoup

article = open('List_of_disasters_in_Great_Britain_and_Ireland_by_death'
               '_toll.html').read()

soup = BeautifulSoup(article, 'html.parser')


def mean(lst):
    return sum(int(e) for e in lst) // len(lst)

# The data we want for the major disasters are in the only sortable table
# on the page.
table = soup.find_all('table', class_='sortable')[0]
for i, row in enumerate(table.find_all('tr')[1:]):
    cells = row.find_all('td')
    deaths_cell, event_cell, date_cell = cells[:3]
    # parse the text of the deaths cell into an integer mean number of deaths.
    deaths = deaths_cell.text
    # remove citations, commas and trailing '+'s; split number ranges.
    deaths = re.sub('\[\d+\]|,|\+', '', deaths).split(' to ')
    deaths = mean(deaths)

    event = event_cell.text

    date = date_cell.text
    # parse the text of the date cell into an integer mean year.
    date = re.sub('\(.+\)|\[\d+\]|\s','', date)
    # 1970s–1980s -> 1975–1985, remove 'ff.', split on en-dash.
    date = date.replace('0s', '5').replace('ff.', '').split('–')
    date = mean(date)

    # get event URLs, if any.
    event_link = event_cell.find_all('a')
    nlinks = len(event_link)
    if nlinks == 0:
        event_link = None
    else:
        event_link = event_link[0]['href']
        # Ignore links redirecting to missing page placeholder.
        if 'redlink=1' in event_link:
            event_link = None
        if event == 'Dumfries cholera epidemic':
            event_link = None
    print('{} :: {} :: {} ::'.format(deaths, date, event))
Now for the two lists of disasters with fewer than 200 fatalities. We need to extract and tidy the number of deaths and the event description from the two lists. One of the hardest parts is parsing the dates, which appear in several different forms in the list items. After trying to match the most common, we're left with three special cases to sort out by hand.
read_lists.py:
import re
from bs4 import BeautifulSoup

article = open('List_of_disasters_in_Great_Britain_and_Ireland_by_death'
               '_toll.html').read()

soup = BeautifulSoup(article, 'html.parser')

def mean(lst):
    return sum(int(e) for e in lst) // len(lst)

def get_list(heading_text):
    headings = soup.find_all('h2')
    for heading in headings:
        if heading.find('span',text=heading_text):
            ul = heading.find_next_sibling('ul')
            return ul

def get_year(event):
    months = ('[January|February|March|April|May|June|July|August|'
                  'September|October|November|December]')
    m = re.search('\((after)?\s?\d+ ' + months + ' (\d\d\d\d)\)', event)
    if not m:
        m = re.search('\(' + months + ' (\d\d\d\d)\)', event)
        if not m:
            m = re.search(months + ' (\d\d\d\d)\)', event)
        if not m:
            # mop up the special cases
            if '1845–1848' in event: return 1846
            if 'September 11, 2001' in event: return 2001
            if '7 July 2005' in event: return 2005
    return m.groups(0)[0]

list_headings = '100–199 fatalities', 'Fewer than 100 fatalities'
for heading_text in list_headings:
    ul = get_list(heading_text)
    for li in ul.find_all('li'):
        deaths, event = li.text.split(' – ', 1)
        year = get_year(event)
        deaths = mean(deaths.rstrip('+?').split('–'))
        print('{} :: {} :: {}'.format(deaths, year, event))
Let's store the parsed data by redirecting the output of these scripts to disasters.txt:
$ python read_table.py >disasters.txt
$ python read_lists.py >>disasters.txt
We'd like the categorise the events, so define a function categorise_event to match keywords in the event text and identify it as one of 12 types (naval, famine, natural disaster, etc.)
import numpy as np
import matplotlib.pyplot as plt

# Read in the list of disasters.
disasters = []
with open('disasters.txt') as fi:
    for line in fi.readlines():
        fields = line.split('::')
        deaths = int(fields[0])
        year = int(fields[1])
        event = fields[2].strip()
        disasters.append((year, deaths, event))

def categorise_event(event):
    """Categorise the event according to keywords found in its description."""

    def find_any(string, substrings):
        """Return True if any of substrings is found in string."""

        return any(x in string for x in substrings)

    if find_any(event.lower(), ('famine',)):
        return 'Famine'
    if find_any(event, ('HMS', 'RMS', 'SS', 'MV', 'fleet', 'shipwreck',
                        'steamer', 'sinking', 'Sinking', 'sank', 'capsize',
                        'boat', 'naval disaster', 'clipper', 'sailing vessel',
                       )):
        return 'Naval'
    if find_any(event.lower(), ('storm', 'flood', 'wind', 'blizzard', 'gale',
                                'avalanche', 'earthquake', 'hurricane',
                                'heat wave', 'volcano', 'without a summer')):
        return 'Natural'
    if find_any(event.lower(), ('colliery', 'mine', 'pit', 'mining', 'coal',
                                'oaks explosion', 'gresford')):
        return 'Mining'
    if find_any(event.lower(), ('cholera', 'flu', 'typhoid', 'black death',
                                'plague', 'sweating sickness', 'porto bello')):
        return 'Epidemic'
    if find_any(event.lower(), ('aircrash', 'flight', 'airline',
                                'air disaster', 'airways', 'take-off',
                                'airship', 'helicopter')):
        return 'Air'
    if find_any(event.lower(), ('fire',)):
        return 'Fire'
    if find_any(event.lower(), ('rail', 'train', 'london underground')):
        return 'Train'
    if find_any(event.lower(), ('stadium', 'spectator', 'compressive asphyxia',
                                'stampede', 'riot', 'panic', 'cinema')):
        return 'Crowd'
    if find_any(event, ('2001 attacks', 'London bombings', 'Black Monday',
                        'Massacre')):
        return 'Terrorism'
    if find_any(event, ('explosion',)):
        return 'Explosion'
    return 'Miscellaneous'

disasters_by_category = {}
decades = np.arange(1000, 2011, 10)
hist = {decade: 0 for decade in decades}
for year, deaths, event in disasters:
    if year < decades[0]:
        continue
    disaster_category = categorise_event(event)
    try:
        categorised_disaster = disasters_by_category[disaster_category]
    except KeyError:
        categorised_disaster = disasters_by_category[disaster_category]\
                             = dict(hist)
    categorised_disaster[year//10 * 10] += deaths
These can then be used to build a stacked barchart on one of two scales. An overview:
categories = ['Naval', 'Famine', 'Natural', 'Mining', 'Epidemic', 'Air',
              'Fire', 'Train', 'Crowd', 'Terrorism', 'Explosion',
              'Miscellaneous']
colours = 'b violet g brown k y r pink c magenta orange gray'.split()

def plot_bars(ax):
    bottoms = np.zeros(len(decades))
    for i, category in enumerate(categories):
        y = [disasters_by_category[category][decade] for decade in decades]
        kwargs = {'alpha': 1, 'width': 8, 'ec': 'none', 'align': 'center'}
        ax.bar(decades, y, bottom=bottoms, fc=colours[i], label=category,
               **kwargs)
        bottoms += y

def plot_overview():
    fig = plt.figure(figsize=(8.4, 8))
    ax = fig.add_subplot(111)

    plot_bars(ax)

    ax.legend(loc='upper left')
    ax.set_yscale('log')
    ax.set_xlabel('Year')
    ax.set_ylabel('Number of deaths')
    ax.set_xlim(800, 2100)
    plt.savefig('disasters_1000-2010.png', dpi=72)
    plt.show()
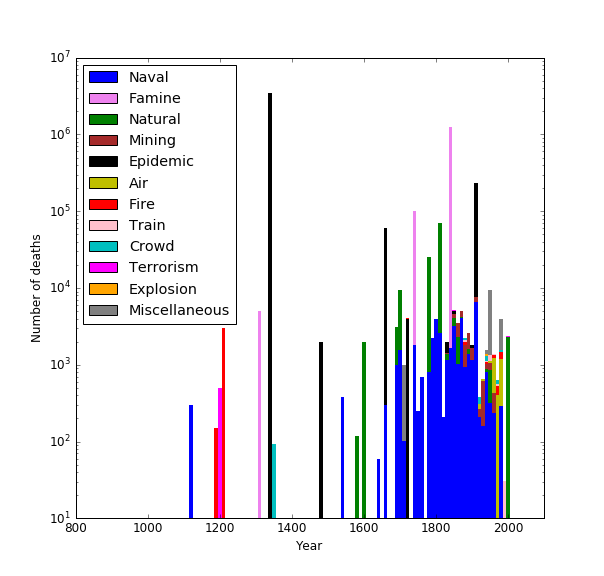
Obviously there is a lot of selection bias going on (many natural disasters which may have killed hundreds or even thousands of people may not have been recorded accurately before the 19th century, for example), but a couple of features stand out (note the log scale). The disasters that kill most people are epidemics (notably the Black Death (1340s), Spanish flu (1918) and the plague (1665)) and famines (1740s and 1840s). The 1400s and 1500s were pretty quiet, by this account.
A bar chart of disasters since 1800 can also be produced:
def plot_last_200_years():
    fig = plt.figure(figsize=(8.4, 8))
    ax = fig.add_subplot(111)

    plot_bars(ax)

    ax.set_xlabel('Year')
    ax.set_ylabel('Number of deaths')
    ax.set_xlim(1795, 2015)
    ax.set_ylim(0, 8000)
    lgd = ax.legend(bbox_to_anchor=(1.4, 1))
    plt.savefig('disasters_1800-2010.png', dpi=72,
                bbox_extra_artists=(lgd,), bbox_inches='tight')
    plt.show()
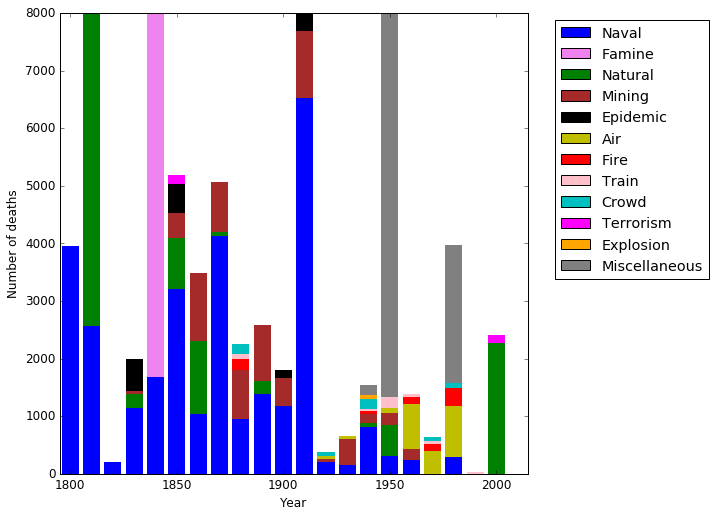
The really major events are off the (linear) scale here, but there are some interesting things:
- Naval (and other ship-related) disasters fall off significantly in the 20th century (the last being the Herald of Free Enterprise capsizing in 1987).
- Mining disasters regularly killed a thousand people each decade in the second half of the 19th century.
- The large grey bar in the 1950s is the "Great Smog" event of 1952.
- Air disasters killed hundreds of people in the 60s, 70s and 80s, but barely feature since then.
- The most recent event with over a thousand deaths is the 2003 heat wave.