Determining mean bond lengths from crystallographic data
Posted on 14 June 2016
The Cambridge Crystallographic Data Centre is a non-profit organisation devoted to small-molecule crystallography data. It curates, validates and distributes the Cambridge Structural Database (CSD) of over 800,000 organic and metal-organic crystal structures. The CSD has an excellent Python API which can be used to analyse these structures. Unfortunately, access to most of the CCDC data requires a paid-for licence or an institutional subscription. In the short project below I obtained the necessary crystal structures using my UCL credentials. Installation and configuration of the database and software is documented on the CCDC website.
To explore the CSD Python API a bit, I thought I'd determine a few carbon-carbon bond lengths. The API allows one to search the database from Python, but apparently does not support Python 3 (yet?), so to minimize the amount of new code I write in Python 2, I downloaded the CSD identifiers of all crystal structures containing carbon atoms using the ConQuest tool. With this file, C-containing_structures.gcd, I can extract the carbon-carbon bond lengths to a one-dimensional NumPy array saved as CC-bondlengths.npy with the following script (NB Python 2.7!)
from __future__ import print_function
import numpy as np
from ccdc import io

filename = 'C-containing_structures.gcd'
mol_reader = io.MoleculeReader(filename, format='identifiers')
bond_lengths = []
i = 0
for mol in mol_reader:
    for component in mol.components:
        for bond in component.bonds:
            if len(bond.atoms) != 2:
                continue
            atom1, atom2 = bond.atoms
            if atom1.atomic_symbol == atom2.atomic_symbol == 'C':
                bond_lengths.append(np.linalg.norm(np.array(atom1.coordinates)
                                - np.array(atom2.coordinates)))
    i += 1
    if not i % 100:
        print(i, mol.identifier)

bond_lengths = np.array(bond_lengths)
np.save('CC-bondlengths.npy', bond_lengths)
Note that this is pretty crude: it examines all the components of the crystal structure, so the results are going to be weighted towards structures with a higher number of molecules per unit cell (e.g. Phenol has a unit cell consisting of three $\mathrm{C_6H_5OH}$ components, all of which have pretty much the same structure).
The bond lengths can be visualized as a histogram:
import numpy as np
import matplotlib.pyplot as plt

bond_lengths = np.load('CC-bondlengths.npy')
nbins = 500
bond_dist, bins = np.histogram(bond_lengths, bins=nbins)
bin_centres = (bins[:-1] + bins[1:])/2

fig, ax = plt.subplots()
bin_width = bins[1] - bins[0]
ax.bar(bin_centres, bond_dist/1000, ec='none', width=bin_width, fc='m',
       alpha=0.5)
ax.set_xlabel('Bond length /Å')
ax.set_ylabel('Number of bonds (1000s)')
plt.savefig('CC-histogram.png')
plt.show()
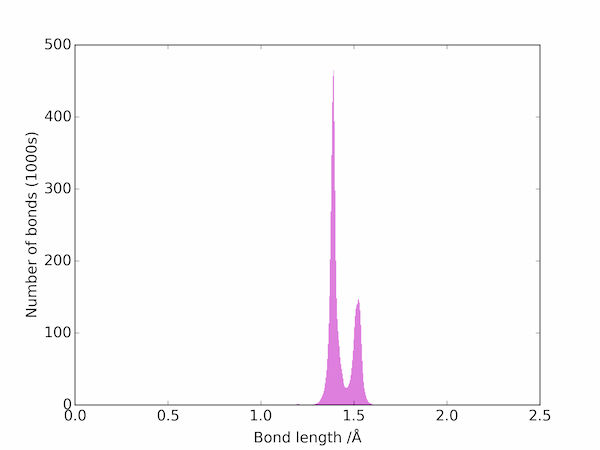
The two peaks correspond to double and single C–C bonds: the triple bonds are apparently much rarer and are not be seen on a linear scale. On a log scale, however, the three main types of bond are easily seen:
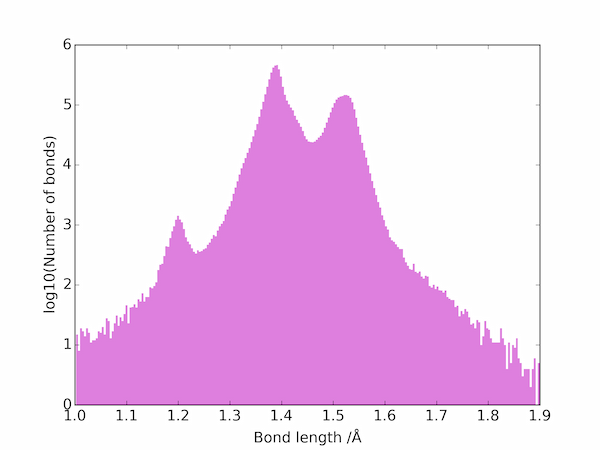
Average values for the different types of carbon-carbon bond in the database can be estimated from the location of the three main maxima to be as follows.
| Bond | Length /Å |
|---|---|
| $\mathrm{C-C}$ | 1.53 |
| $\mathrm{C=C}$ | 1.39 |
| $\mathrm{C\equiv C}$ | 1.20 |
Note that this is not a good way to estimate the average length of carbon-carbon bonds in general: it is clearly biased towards the aromatic bonds found in the types of organic molecules heavily represented in the database. The bond lengths found for non-delocalized $\mathrm{C=C}$ bonds are more like 1.35 Å.