Approximating images with overlapping straight lines
Posted on 04 March 2021
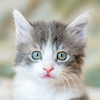
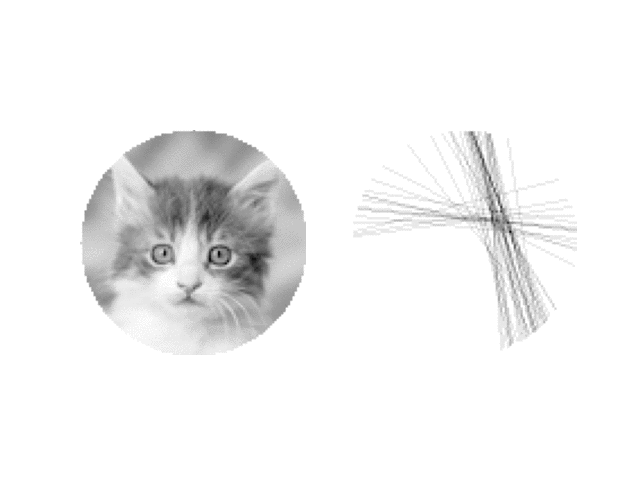
Just a quick script to approximate a given target image from a large number of overlapping straight lines. The algorithm is rather inefficient: each line is added to several copies of the the approximation so far, and the best one chosen (ie the one that differs least, in a root mean square sense, from the target image). The following animation is built up, using a target image adapted from target-kitten.png (credit: Kote Puerto).
import sys
from PIL import Image
import numpy as np
import matplotlib.pyplot as plt
from skimage.draw import line

img = Image.open('target-kitten.png').convert('L')
nx, ny = img.width, img.height
# The image must be square
assert nx == ny
n = nx

# Some parameters defining the image approximation: number of lines to draw in
# total, the weight of the lines (ie how much to increase the array values by
# on the chord chosen), and the number of random lines to examine for the best
# one to draw as we add each of the nlines lines.
nlines, dw, nattempts = 5000, 2, 50

# We have to copy because otherwise the array is not writeable and we want
# to apply a mask.
img = np.asarray(img).copy()

# Create a circular mask
Y, X = np.ogrid[:n, :n]
r = n // 2
C = np.array((r, r), dtype=int)
dist = np.sqrt((X - r)**2 + (Y - r)**2)
mask = dist <= r
img[~mask] = 255

# Invert the image.
img = 255 - img

def draw_random_line(arr):
    """Draw a random chord between points on the edge of the circular mask."""
    th0 = 2*np.pi * np.random.random()
    x0, y0 = r + int(r * np.cos(th0)), r + int(r * np.sin(th0))
    # Make sure the chords are reasonably long.
    dth = 2*np.pi * (np.random.random() / 2 + 0.5)
    th1 = th0 + dth
    x1, y1 = r + int(r * np.cos(th1)), r + int(r * np.sin(th1))
    rr, cc = line(x0, y0, x1, y1); val = 1
    arr[rr, cc] += val * dw
    arr = np.clip(arr, 0, 255)

def plot_figs(k, axes):
    """Plot the image to be reproduced alongside our approximation."""
    ax0, ax1 = axes
    ax0.clear()
    ax1.clear()

    # Uninvert the image arrays, of course.
    ax0.imshow(255-img, cmap=plt.get_cmap('gray'))
    ax1.imshow(255-arr, cmap=plt.get_cmap('gray'))
    ax0.axis('off')
    ax1.axis('off')
    plt.savefig('frames/kittens_{:04d}.png'.format(k))

fig, axes = plt.subplots(nrows=1, ncols=2)
arr = np.zeros(img.shape)

k = 0
for i in range(nlines):
    if i and not i % 100:
        print('{}/{}'.format(i, nlines))
    # Some NumPy jiggery-pokery to get nattempts copies of the array we're
    # building, arranged along the first axis.
    arrc = np.repeat(arr[:, :, np.newaxis], nattempts, axis=2)
    arrc = np.rollaxis(arrc, 2)
    # J is to be our measure of goodness, the rms difference between the
    # array after a given random line has been added and the target image.
    J = np.empty(nattempts)
    for j in range(nattempts):
        draw_random_line(arrc[j])
        J[j] = np.sum((img-arrc[j])**2)
    # Choose the best approximation so far.
    arr = arrc[J.argmin()]
    if i and not i % 50:
        plot_figs(k, axes)
        k += 1