Animated landscapes with Matplotib
Posted on 20 December 2020
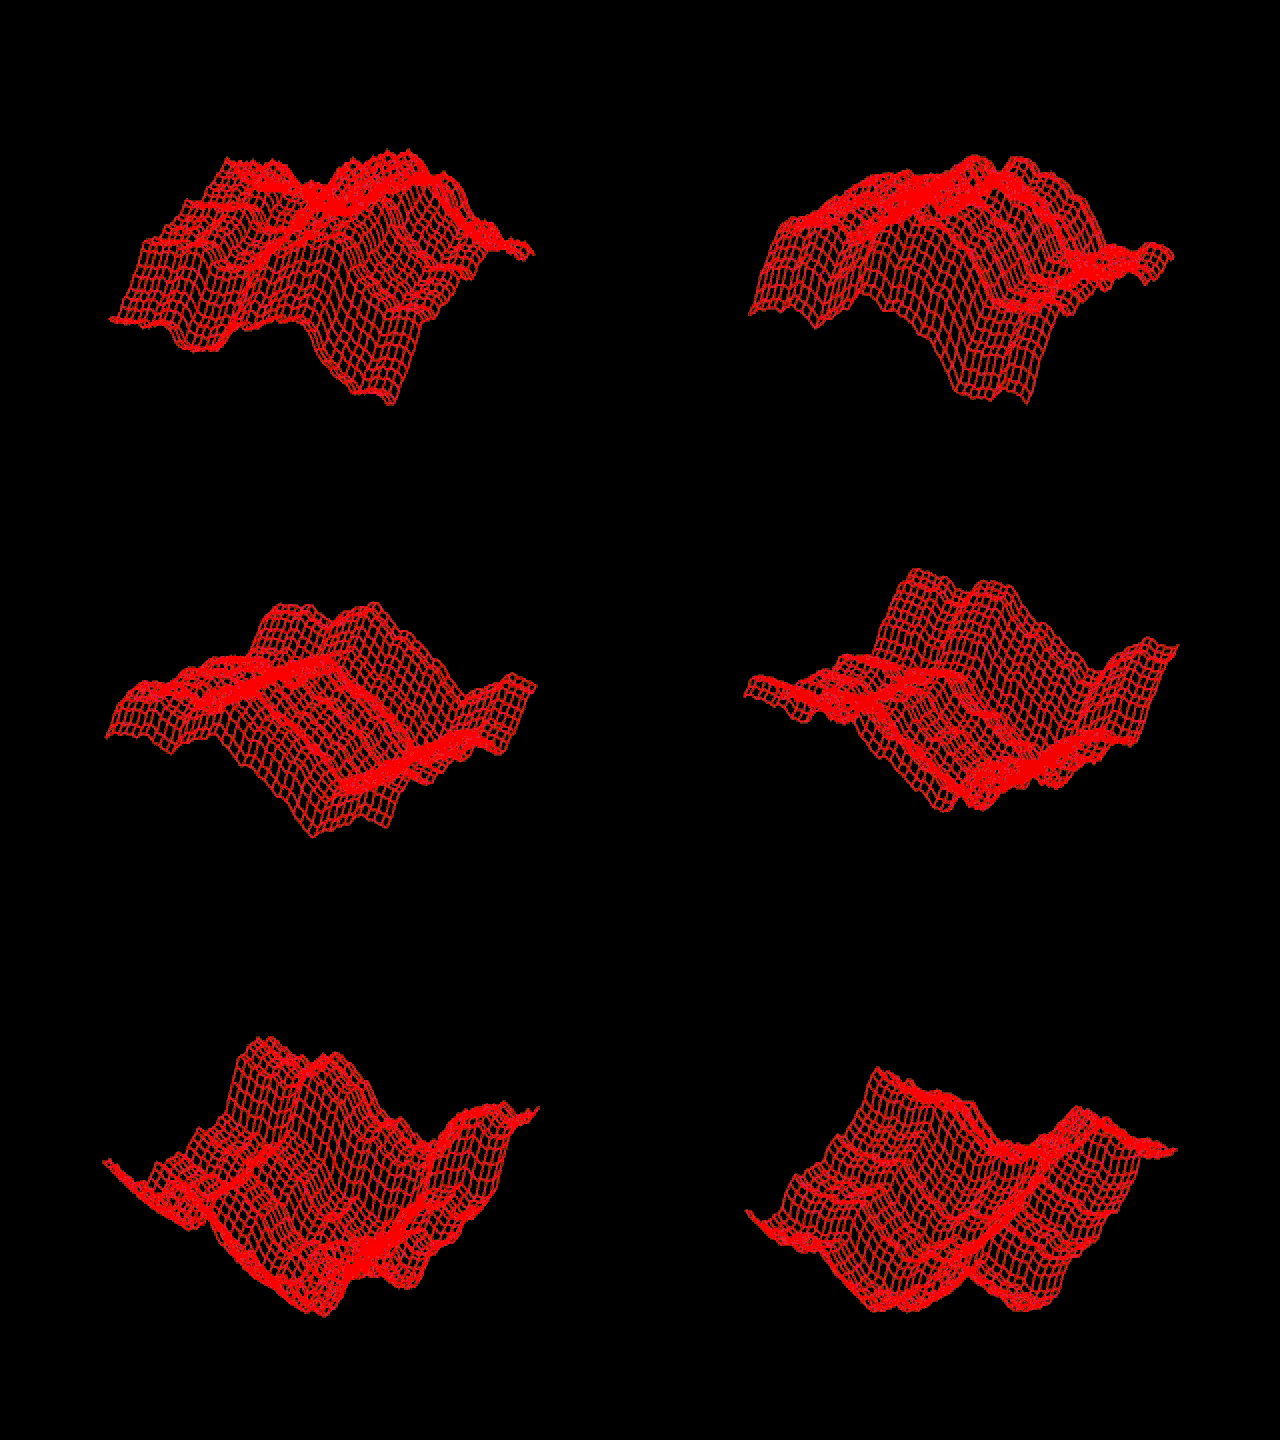
Just a quick experiment in creating animated surfaces in Matplotlib. The distortions to the plane are sine waves applied in octaves with a random phase, $\phi_n$:
$$ f(x) = \sum_{n=1}^{m} A_n\sin\left( \frac{2\pi f_n x}{N_x} - \phi_n \right) $$ where $A_n = 1/n$ is the amplitude (decreasing with increasing frequency) and $f_n = 2^{(n-1)}$ is the frequency of the $n$th wave.

The animation is achieved by changing the phase in each direction, either randomly or incrementally, creating a wave-like effect.
import numpy as np
import matplotlib.pyplot as plt
import mpl_toolkits.mplot3d.axes3d as axes3d
from utils import set_params, make_Z, make_animation

np.random.seed(2)

# Size of the plane (pixels).
NX, NY = 200, 200
X, Y = np.meshgrid(np.arange(NX), np.arange(NY))

# Number of octaves in each direction.
ncx, ncy = 8, 6
xprms, yprms = set_params(ncx, ncy)

def plot_wireframe(ax, X, Y, Z):
    """Plot the Z surface as a wireframe."""

    surf = ax.plot_wireframe(X, Y, Z, rstride=5, cstride=5, colors='r')
    ax.set_xlim(0, NX)
    ax.set_ylim(0, NY)
    ax.axis('off')
    # Explicitly set the aspect ratio to stop Matplotlib forcing the (X,Y)
    # domain to be square.
    ax.set_box_aspect((NX, NY, np.ptp(Z)*100))
    return surf

def update_prms(xprms, yprms):
    """Update the phase paramter for each frame of the animation."""

    xprms[2] += 0.2 * (np.random.random(xprms[2].shape) - 1)
    yprms[2] += 0.2 * (np.random.random(yprms[2].shape) - 1)
    return xprms, yprms

ani = make_animation(X, Y, xprms, yprms, update_prms, plot_wireframe, False)
plt.show()
This code requires the following file, utils.py, defining some utility functions:
import numpy as np
import matplotlib.pyplot as plt
import matplotlib.animation as animation

def set_params(ncx, ncy):
    """Set the ncx x-direction parameters and ncy y-direction parameters."""

    # Frequencies, in octaves.
    fx, fy = 2**np.arange(ncx), 2**np.arange(ncy)
    # Octave amplitudes, decreasing as 1/n.
    Ax, Ay = 1/2**np.arange(1,ncx+1), 1/2**np.arange(1,ncy+1)
    # Random phases.
    phx = 2 * np.pi * np.random.random(ncx)
    phy = 2 * np.pi * np.random.random(ncy)
    return np.vstack((fx, Ax, phx)), np.vstack((fy, Ay, phy))


def make_Z(X, Y, xprms, yprms):
    """Make the Z array of altitudes (distortions to the planes."""

    # Initalize Z and unpack the parameters
    NX, NY = X.shape[1], Y.shape[0]
    Z = np.zeros((NY, NX))
    fx, Ax, phx = xprms
    fy, Ay, phy = yprms

    for i in range(xprms.shape[1]):
        Z += Ax[i] * np.sin((2*np.pi*fx[i])*X/NX - phx[i])
    for i in range(yprms.shape[1]):
        Z += Ay[i] * np.sin((2*np.pi*fy[i])*Y/NY - phy[i])

    # Normalize Z to [0, 1].
    minZ, maxZ = np.min(Z), np.max(Z)
    Z = (Z - minZ)/(maxZ - minZ)
    return Z

def make_animation(X, Y, xprms, yprms, update_prms, plot_surf, save=False):
    """Make a Matplotlib animation.

    Make the animation by updating the parameters according to the provided
    function, update_prms; the function plot_surf actually creates the plotted
    surface on each iteration of the animation.

    """

    def animate(i, xprms, yprms, surf):
        """The animation function to call for each animation frame."""
        ax.clear()
        xprms, yprms = update_prms(xprms, yprms)
        Z = make_Z(X, Y, xprms, yprms)
        surf = plot_surf(ax, X, Y, Z)
        return surf,

    # 3D surface plot, black backgrounds, no padding around the Axes.
    fig, ax = plt.subplots(subplot_kw=dict(projection='3d', facecolor='k'),
                           facecolor='k')
    fig.subplots_adjust(left=0, right=1, bottom=0, top=1)

    # Initialize the plot.
    NX, NY = X.shape[0], Y.shape[1]
    Z = make_Z(X, Y, xprms, yprms)
    surf = plot_surf(ax, X, Y, Z)
    ax.axis('off')

    # The animation itself; no point in blitting: almost everything will change
    # in each animation frame.
    ani = animation.FuncAnimation(fig, animate, fargs=(xprms, yprms, surf),
                                  interval=10, blit=False, frames=200)
    if save:
        ani.save('animation.mp4', fps=24)
    return ani

def make_animation_fbf(X, Y, xprms, yprms, update_prms, plot_surf, nframes=60):
    """Alternative animation routine: save individual frames as PNG images ."""

    def animate(i, xprms, yprms, surf):
        """The animation function to call for each animation frame."""
        ax.clear()
        xprms, yprms = update_prms(xprms, yprms)
        Z = make_Z(X, Y, xprms, yprms)
        surf = plot_surf(ax, X, Y, Z)
        return surf,

    fig, ax = plt.subplots(subplot_kw=dict(projection='3d', facecolor='k'),
                           facecolor='k')
    fig.subplots_adjust(left=0, right=1, bottom=0, top=1)
    NX, NY = X.shape[0], Y.shape[1]
    Z = make_Z(X, Y, xprms, yprms)
    surf = plot_surf(ax, X, Y, Z)
    ax.axis('off')

    for i in range(nframes):
        print('{} / {}'.format(i, nframes))
        animate(i, xprms, yprms, surf)
        plt.savefig('frames/frame-{:03d}.png'.format(i))
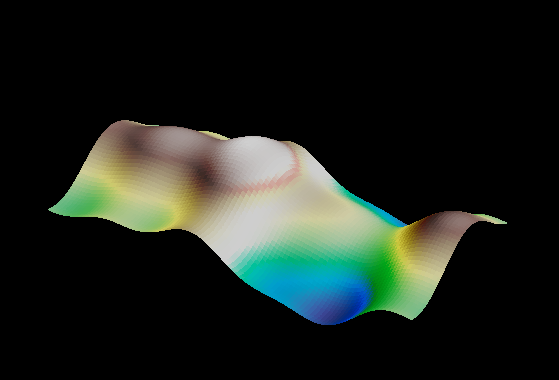
An alternative usage of these routines can plot the surface as a terrain map, with highlights provided by Matplotlib's LightSource class:

import numpy as np
import matplotlib.pyplot as plt
import mpl_toolkits.mplot3d.axes3d as axes3d
from matplotlib.colors import LightSource
from utils import set_params, make_Z, make_animation

np.random.seed(42)

# Size of the plane (pixels).
NX, NY = 200, 100
X, Y = np.meshgrid(np.arange(NX), np.arange(NY))

# Number of octaves in each direction.
ncx, ncy = 3, 1
xprms, yprms = set_params(ncx, ncy)

# Terrain colormap and lightsource for highlights
cmap = plt.cm.terrain
light = LightSource(90, 45)

def plot_terrain_surf(ax, X, Y, Z):
    """Plot the Z surface as a highlighted terrain map."""
    illuminated_surface = light.shade(Z, cmap=cmap)
    surf = ax.plot_surface(X, Y, Z, rstride=2, cstride=2, lw=0,
                           antialiased=False, facecolors=illuminated_surface)
    ax.set_xlim(0, NX)
    ax.set_ylim(0, NY)
    ax.axis('off')
    ax.set_box_aspect((NX, NY, np.ptp(Z)*50))
    return surf

def update_prms(xprms, yprms):
    """Update the phase paramter for each frame of the animation."""
    xprms[2] += 0.2 * (np.random.random(xprms[2].shape) - 1)
    yprms[2] += 0.2 * (np.random.random(yprms[2].shape) - 1)
    return xprms, yprms

ani = make_animation(X, Y, xprms, yprms, update_prms, plot_terrain_surf, True)
plt.show()