A "universal" formula for egg shape
Posted on 19 April 2022
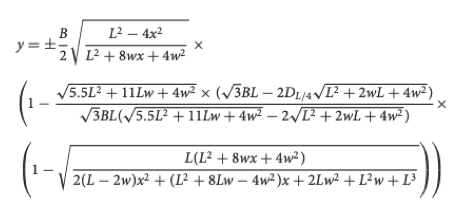
A recent article, Narushin et al., "Egg and math: introducing a universal formula for egg shape", Ann. N.Y. Acad. Sci. 1505, 169 (2021) introduces a "universal" formula for the shape of eggs, including "pyriform" (pear-shaped) eggs such as those of the guillemot – supposedly, such eggs roll in a circle when disturbed so that they do not fall off the cliffs where these birds nest.
The formula is given as equation (5) in the above publication:

where $x$ should vary between $-L/2$ and $L/2$ where $L$ is the length of the egg; $B$ is the maximum breadth of the egg; $w$ is the distance between two vertical lines corresponding to the maximum breadth and $y$-axis (with the origin taken to be at the centre of the egg); $D_{L/4}$ is the egg diameter at the point a distance L/4 from the pointed end.
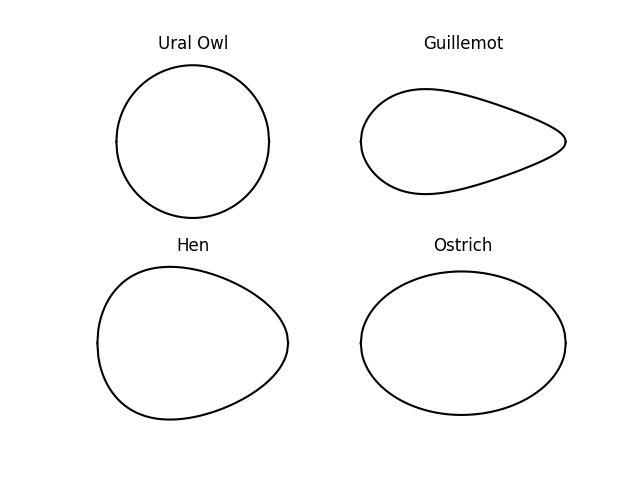
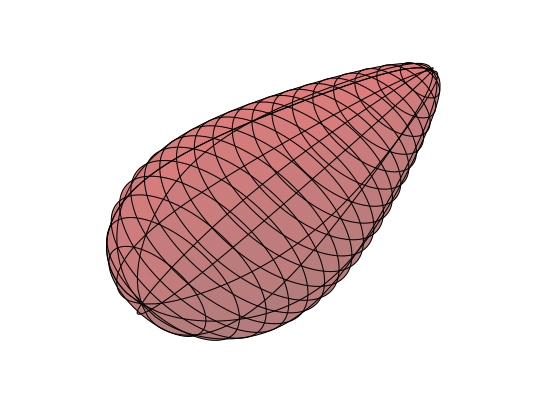
The code below uses this formula to render the cross sections of various bird eggs and also to produce a 3D image of a pyriform egg, using Matplotlib.


import numpy as np
import matplotlib.pyplot as plt
import mpl_toolkits.mplot3d.axes3d as axes3d

def yegg(x, L, B, w, D):
    """
    The "universal" formula for an egg, from Narushin et al., "Egg and math:
    introducing a universal formula for egg shape", *Ann. N.Y. Acad. Sci.*,
    **1505**, 169 (2021).

    x should vary between -L/2 and L/2 where L is the length of the egg; B
    is the maximum breadth of the egg; w is the distance between two vertical
    lines corresponding to the maximum breadth and y-axis (with the origin
    taken to be at the centre of the egg); D is the egg diameter at the point
    a distance L/4 from the pointed end.

    """

    fac1 = np.sqrt(5.5*L**2 + 11*L*w + 4*w**2)
    fac2 = np.sqrt(L**2 + 2*w*L + 4*w**2)
    fac3 = np.sqrt(3)*B*L
    fac4 = L**2 + 8*w*x + 4*w**2
    return (B/2) * np.sqrt((L**2 -4*x**2) / fac4) * (
        1 - (fac1 * (fac3 - 2*D*fac2) / (fac3 * (fac1 - 2*fac2)))
     * (1 - np.sqrt(L*fac4 / (2*(L - 2*w)*x**2
                    + (L**2 + 8*L*w - 4*w**2)*x + 2*L*w**2 + L**2*w + L**3))))

def plot_egg_contour(ax, title, x, L, B, w, D):
    y = yegg(x, L, B, w, D)
    ax.plot(x, y, 'k')
    ax.plot(x, -y, 'k')
    ax.axis('equal')
    ax.axis('off')
    ax.set_title(title)


fig, axes = plt.subplots(nrows=2, ncols=2)
L = 1
x = np.linspace(-L/2, L/2, 200)
# Circular egg (e.g. Ural owl).
plot_egg_contour(axes[0][0], 'Ural Owl', x, L, L, 0, L * np.sqrt(3) / 2)
# Hen egg.
plot_egg_contour(axes[1][0], 'Hen',  x, L, 0.8, 0.1, 0.6)
# Guillemot egg (pyriform).
plot_egg_contour(axes[0][1], 'Guillemot', x, L, 0.5, 0.1, 0.3)
# Ostrich egg.
plot_egg_contour(axes[1][1], 'Ostrich', x, L, 0.7, 0, 0.6)
plt.show()

# Render a 3D image of a guillemot egg.
B, w, D = 0.5, 0.1, 0.3

phi = np.linspace(0, 2*np.pi, 100)
X, Phi = np.meshgrid(x, phi)
Y = yegg(X, L, B, w, D) * np.cos(Phi)
Z = yegg(X, L, B, w, D) * np.sin(Phi)

fig = plt.figure()
ax = fig.add_subplot(projection='3d')
ax.plot_surface(X, Y, Z, alpha=0.3, color='r', rstride=10, cstride=10)
ax.plot_wireframe(X, Y, Z, color='k', rstride=10, cstride=10, lw=1)
ax.set_xlim(-L/2, L/2)
ax.set_ylim(-L/2, L/2)
ax.set_zlim(-L/2, L/2)

ax.axis('off')
plt.show()