A customizable Ebbinghaus illusion
Posted on 09 February 2017
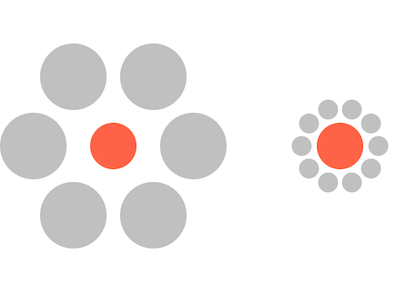
The Ebbinghaus illusion is a famous visual effect based on the perception of the relative size. Two circles of the same size are surrounded in one case by obviously larger circles and in the other by obviously smaller circles. The former is perceived as being smaller than the latter, as illustrated below.

The following code generates SVG images illustrating the Ebbinghaus illusion, in which several of the properties of the arrangement of circles can be customized. The customizable parameters are:
filename: the name of the SVG file to write.width,height: the size of the SVG image in pixels.r: the radius of the central circle.r_smaller: the radii of the small surrounding circles.r_larger: the radii of the large surrounding circles.nsmall: the number of small circles.nlarge: the number of large circles.dist_ratio_small: the distance between the edge of the central circle and the centre of each small circle expressed as a ratio of the small circle radius (should be greater than 1 or the circles will overlap).dist_ratio_large: the distance between the edge of the central circle and the centre of each large circle expressed as a ratio of the large circle radius (should be greater than 1 or the circles will overlap).centre_color: a colour specification (HTML name or hex string) for the colour of the central circles.surrounding_color: a colour specification (HTML name or hex string) for the colour of the surrounding circles.separation: the separation of the central circles in pixels.
Default values for these parameters are provided to the ebbinghaus function.
import math

def svg_preamble(width=600, height=450):
    return ('<svg width="{}" height="{}"'
          ' xmlns="http://www.w3.org/2000/svg"'
          ' xmlns:xlink= "http://www.w3.org/1999/xlink">'.format(width,height))

def ebbinghaus(filename='ebbinghaus.svg', width=600, height=450, r=35,
                 r_smaller=15, r_larger=50, nsmall=10, nlarge=6,
                 dist_ratio_small=1.2, dist_ratio_large=1.5,
                 centre_colour='tomato', surrounding_colour='silver',
                 separation=350):
    """The Ebbinghaus illusion.

    Write an SVG image of the Ebbinghaus circles illusion with the following
    parameters:

    filename: the name of the SVG file to write.
    width, height: the size of the SVG image in pixels.
    r: the radius of the central circle.
    r_smaller: the radii of the small surrounding circles.
    r_larger: the radii of the large surrounding circles.
    nsmall: the number of small circles.
    nlarge: the number of large circles.
    dist_ratio_small: the distance between the edge of the central circle and
        the centre of each small circle expressed as a ratio of the small
        circle radius (should be greater than 1 or the circles will overlap).
    dist_ratio_large: the distance between the edge of the central circle and
        the centre of each large circle expressed as a ratio of the large
        circle radius (should be greater than 1 or the circles will overlap).
    centre_color: a colour specification (HTML name or hex string) for the
        colour of the central circles.
    surrounding_color: a colour specification (HTML name or hex string) for the
        colour of the surrounding circles.
    separation: the separation of the central circles in pixels.


    """

    # Centres of the circles surrounded by larger and smaller circles.
    x1, y1 = (r_larger + r) * 2, height/2
    x2, y2 = x1 + separation, y1

    def svg_circle(r, x0, y0, s_class):
        """A circle at (x0, y0) with radius r and class s_class."""

        return ('<circle cx="{:.1f}" cy="{:.1f}" r="{:.1f}" class="{}"/>'
                        .format(x0, y0, r, s_class))

    def arrange_circles(cr, r, x0, y0, n, s_class):
        """Arrange circles on the circumference of a larger circle.

        Arrange n circles of radius r on a circle of radius cr, centered
        at (x0, y0) and attach style class s_class to them."""

        for i in range(n):
            th = 2 * math.pi * i / n
            x = x0 + cr * math.cos(th)
            y = y0 + cr * math.sin(th)
            print(svg_circle(r, x, y, s_class), file=fo)

    with open(filename, 'w') as fo:
        print(svg_preamble(), file=fo)
        print('<style>\n    /* <![CDATA[ */', file=fo)
        print('      .inner {{fill: {};}}'.format(centre_colour), file=fo)
        print('      .smaller, .larger {{fill: {};}}'.format(
                                             surrounding_colour), file=fo)
        print('    /* ]]> */\n</style>', file=fo)

        print(svg_circle(r, x1, y1, 'inner'), file=fo)
        print(svg_circle(r, x2, y2, 'inner'), file=fo)

        arrange_circles(r + r_larger*dist_ratio_large, r_larger, x1, y1,
                        nlarge, 'larger')
        arrange_circles(r + r_smaller*dist_ratio_small, r_smaller, x2, y2,
                        nsmall,'smaller')

        print('</svg>', file=fo)
The figure above was generated with:
ebbinghaus('ebbinghaus1.svg', dist_ratio_small=1.5, dist_ratio_large=1.7,
           separation=330)
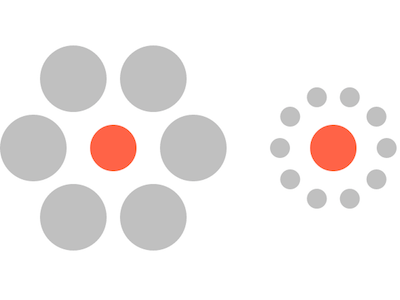
Moving the smaller circles further from the central circle they surround arguably makes the illusion less striking, an effect discussed by B. Roberts, M. G. Harris and T. A. Yates, Perception 34, 847 (2005):
ebbinghaus('ebbinghaus2.svg', dist_ratio_small=3, dist_ratio_large=1.7,
           separation=330)
