Posted by: christian on 29 Nov 2022
A Maurer rose is a shape formed by connecting the points on a rose defined in the polar coordinate system by $r = \sin(n\theta)$ for some positive integer, $n$. The points to join are, in polar coordinates using degrees:
$$ (r, \theta) = (\sin(nk), k)\;\mathrm{for}\;k=0, d, 2d, \ldots, 360d $$
For example, the Maurer rose defined by $n=4, d=120$ is:
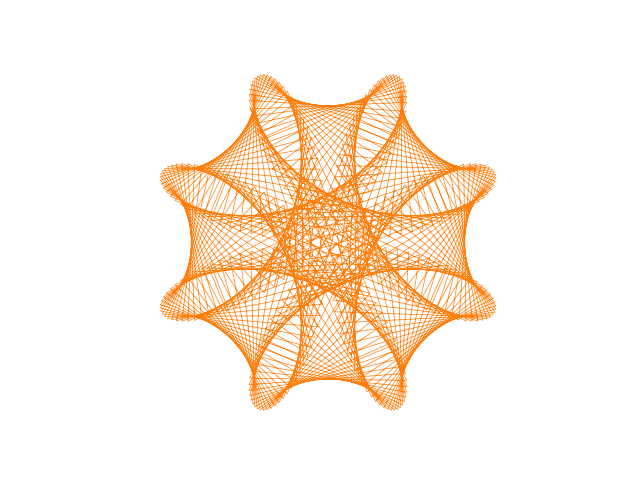
The following Python code plots a Maurer rose for parameters $n$ and $d$ provided on the command line, for example:
$ python maurerrose.py 4 120
the code requires NumPy and Matplotlib.
import sys
import numpy as np
import matplotlib.pyplot as plt

"""Plot a "Maurer Rose" with (integer) parameters n, d."""

def get_rose_xy(n, d):
    """Get the Cartesian coordinates for points on the rose."""

    # The rose is (r = sin(nk), k) in polar coordinates, for
    # k = d, 2d, 3d, ..., 360d.
    # Add a final point at 361d to close the curve when plotted.
    k = d * np.linspace(0, 361, 361)
    r = np.sin(np.radians(n * k))
    x = r * np.cos(np.radians(k))
    y = r * np.sin(np.radians(k))
    return x, y

def draw_rose(ax, n, d, c='r'):
    """Draw the Maurer rose defined by (n, d) in colour c."""

    x, y = get_rose_xy(n, d)
    ax.plot(x, y, c=c, lw=0.5)
    ax.axis('equal')
    ax.axis('off')

if __name__ == '__main__':
    n, d = int(sys.argv[1]), int(sys.argv[2])
    fig, ax = plt.subplots()
    draw_rose(ax, n, d, 'tab:orange')
    plt.show()
The following code uses the get_rose_xy function to create an animation showing how the geometry of a Maurer Rose changes with the parameter, $d$:
import sys
from functools import partial
import matplotlib.pyplot as plt
from matplotlib import animation
from maurerrose import get_rose_xy

"""Animate a Maurer rose with a given n for increasing d."""

# Colours will change according to this colormap as d advances.
cmap = plt.get_cmap('hsv')

# Read n from the command line, initialize d to 1.
n, d = int(sys.argv[1]), 1

# New Figure with a single Axes and a black background.
fig, ax = plt.subplots(facecolor='k')

# Initial plot.
x, y = get_rose_xy(n, d)
line, = ax.plot(x, y, c='r', lw=0.5)
# Annotate with the values of n and d.
ax.text(0.8, 0.9, f'n = {n}', ha='left', c='w')
text = ax.text(0.8, 0.8, f'd = {d}', ha='left', c='w')
# Make the Axes square and turn off tick marks, labels and spines.
ax.axis('equal')
ax.axis('off')

def init_animation():
    """Initialize animation: line and text are handed around at each frame."""
    return line, text

def animate(i):
    """Advance the animation by one frame, increasing d by 1."""

    global d
    d += 1
    x, y = get_rose_xy(n, d)
    line.set_data(x, y)
    # Also advance the colour, mapping i to [0,1]:
    c = cmap(i / 360)
    line.set_color(c)
    # Update the text label indicating the value of d.
    text.set_text(f'd = {d}')
    return line, text

frames = 360
interval = 50
#
anim = animation.FuncAnimation(fig, animate,
                    init_func=init_animation, frames=frames,
                    interval=interval)

# If we're saving the animation as a video, uncomment these two lines.
#writer = animation.FFMpegWriter(fps=20)
#anim.save('maurer-rose.mp4', writer=writer)

# If we're just viewing the animation locally, uncomment this line.
plt.show()
Comments
Comments are pre-moderated. Please be patient and your comment will appear soon.
djeffal khaled 1 year, 5 months ago
thanks
Link | ReplyNew Comment