Question P9.2.5
The HITRAN database provides a list of molecular line intensities for modeling radiative transmission in planetary atmospheres. Its native format consists of 160-character records of fixed-width fields.
Use pandas to read in the file CO2-transitions.par. This text file contains fixed-width fields; the relevant fields are in character columns 4 – 15 (wavenumber, $\tilde{\nu}$, in $\mathrm{cm^{-1}}$) and columns 16 – 25 (spectral line intensity, $S$, at 296 K in $\mathrm{cm^{-1}/(molecule\,cm^{-2})}$, weighted by isotopologue abundance). Note: these column numbers are indexed starting at 1.
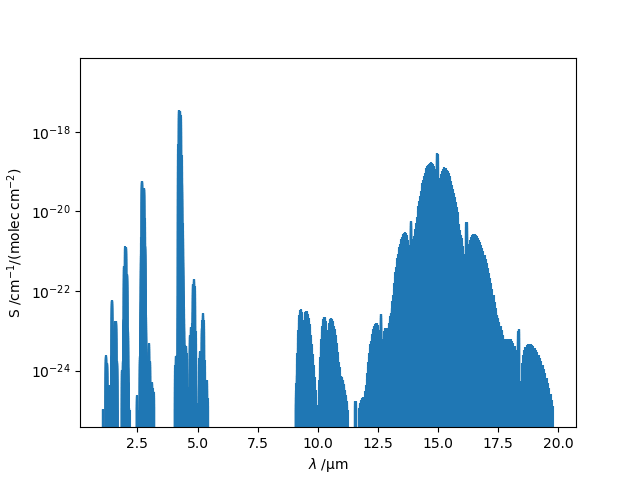
Plot line intensity against wavelength for these transitions in the infrared region of the spectrum ($\lambda$ = 1 μm to 20 μm, corresponding to wavenumber $\tilde{\nu} = 500\;\mathrm{cm^{-1}}$ to $10\,000\;\mathrm{cm^{-1}}$), where carbon dioxide ($\mathrm{CO_2}$) is responsible for a significant fraction of the greenhouse effect in Earth's atmosphere.
Hint: Use Matplotlib's stem plotting function.
Solution P9.2.5
Here is one approach:
import pandas as pd
import matplotlib.pyplot as plt

df = pd.read_fwf('CO2-transitions.par', colspecs=[(3, 15), (15, 25)],
                 header=None, names=['nu', 'S'])
df['lambda /um'] = 1.e4 / df['nu']

fig, ax = plt.subplots()
ax.stem(df['lambda /um'], df['S'], use_line_collection=True, markerfmt='none')
ax.set_yscale('log')
ax.set_xlabel('$\lambda\;/\mathrm{\mu m}$')
ax.set_ylabel('S /$\mathrm{cm^{-1}/(molec\,cm^{-2})}$')
plt.show()