Question P9.2.3
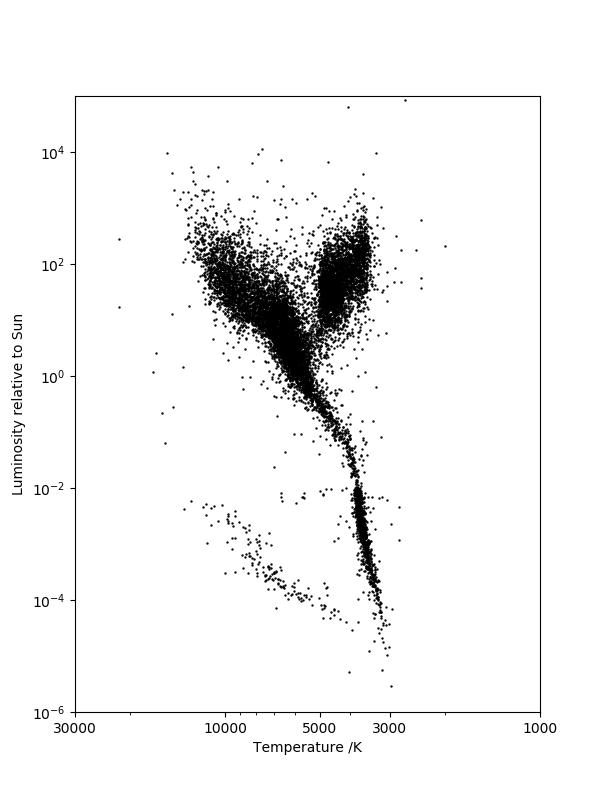
The Hertzsprung–Russell diagram classifies stars on a scatter plot: each star is represented as a point with an $x$-coordinate of effective temperature and a $y$-coordinate of luminosity, a measure of the star's radiated electromagnetic power.
The compressed file hygdata_v3-abridged.csv.gz represents a version of the HYG-database, released under a Creative Commons Attribution-ShareAlike license} which provides data on 119614 stars.
Read in these data with pandas and plot a Hertzsprung--Russell diagram. The luminosity column is identified as 'lum' in the header and the star temperature can be calculated from its color index (also referred to as $(B-V)$ and identified as the column labeled 'ci') using the Ballesteros formula:
$$
T\;/\mathrm{K} = 4600\left( \frac{1}{0.92(B-V)+1.7} + \frac{1}{0.92(B-V)+0.62} \right).
$$
Note that the luminosity is best visualized on a logarithmic scale and the temperature axis is usually plotted in reverse (decreasing temperature towards the right-hand side of the diagram).
Solution P9.2.3
Here is one solution:
import pandas as pd
import matplotlib.pyplot as plt
from matplotlib.ticker import ScalarFormatter

# Read in data and calculate stellar temperature from the Ballesteros formula.
df = pd.read_csv('hygdata_v3-abridged.csv')
df['T'] = 4600 * (1/(0.92*df['ci'] + 1.7) + 1/(0.92*df['ci'] + 0.62))

# Set the aspect ratio for maximum clarity.
DPI = 100
width, height = 600, 800
fig, ax = plt.subplots(figsize=(width/DPI, height/DPI))
# Log-log plot with suitable ticks and labels.
ax.scatter(df['T'], df['lum'], s=0.5, c='k')
ax.set_yscale('log')
ax.set_xscale('log')
ax.set_ylim(1.e-6, 1.e5)
ax.set_xlim(30000,1000)
ax.set_xticks([30000, 10000, 5000, 3000, 1000])
# The chosen xticks don't get used unless we explicitly set a ScalarFormatter.
ax.get_xaxis().set_major_formatter(ScalarFormatter())
ax.set_xlabel('Temperature /K')
ax.set_ylabel('Luminosity relative to Sun')

plt.show()