Question P7.4.3
A bubble chart is a type of scatter plot which can depict three dimensions of data through the position ($x$ and $y$ coordinates) and size of the marker. The plt.scatter method can produce bubble charts by passing the marker size to its s attribute (in $(\mathrm{points})^2$ such that the area of the marker is proportional to the magnitude of the third dimension).
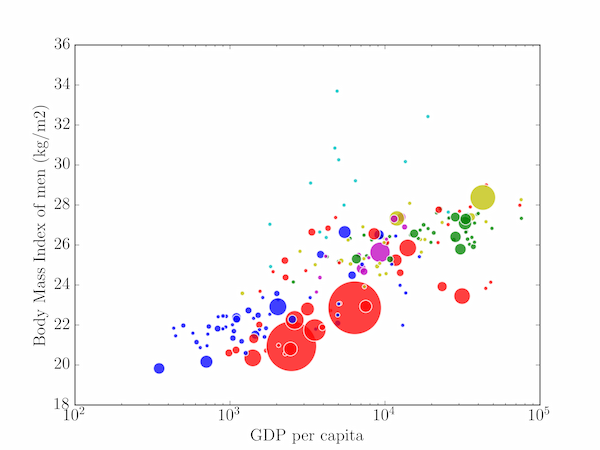
The files gdp.tsv, bmi_men.tsv and population_total.tsv contain the following data from 2007 for each country: the GDP per person per capita in international dollars fixed at 2005 prices, the body mass index (BMI) of men (in $\mathrm{kg/m^2}$) and the total population. Generate a bubble chart of BMI against GDP, in which the population is depicted by the size of the bubble markers. Beware: some data is missing for some countries.
Bonus exercise: colour the bubbles by continent using the list provided in the file continents.tsv.
Solution P7.4.3
Here is one approach:
import numpy as np
import matplotlib.pyplot as plt

def read_data(filename, data_type=float):
    """
    Read in data from filename from two-column, tab-separated format
    of country, value pairs. Cast the value to the data type specified
    by data_type and return it as values to a dictionary keyed by country.

    """

    print('Reading data from file {}'.format(filename))
    data = {}
    with open(filename, 'r') as fi:
        for line in fi.readlines():
            fields = line.split('\t')
            if len(fields) != 2:
                # No data for this country
                continue
            country, value = fields[0], fields[1].strip()
            if not value:
                # Blank data field for this country
                continue
            data[country] = data_type(value)
    return data

# Read in the raw data
raw_pop = read_data('population_total.tsv')
raw_bmi = read_data('bmi_men.tsv')
raw_gdp = read_data('gdp.tsv')
continent = read_data('continents.tsv', str)

# Get an alphabetically-sorted list of countries which have entries in all
# of the data sets just read in.
countries = set(raw_pop.keys()) & set(raw_bmi.keys()) & set(raw_gdp.keys())\
            & set(continent.keys())
countries = sorted(list(countries))

# Convert the dictionaries of data to numpy arrays
pop = np.array([raw_pop[country] for country in countries])
bmi = np.array([raw_bmi[country] for country in countries])
gdp = np.array([raw_gdp[country] for country in countries])

# Set the colours of the plotted bubbles by continent
continent_colours = {'Africa': 'b', 'Asia': 'r', 'North America': 'y',
                     'South America': 'm', 'Europe': 'g', 'Oceania': 'c'}
colours = [continent_colours[continent[country]] for country in countries]

# Set the bubble sizes (circle areas) by population, scaled to 2000 pts^2
# per billion people, but with a minimum size of 16 pts^2
sizes = np.clip(pop / 1.e9 * 2000, 16, None)

fig = plt.figure()
ax = fig.add_subplot(111)
sct = ax.scatter(gdp, bmi, s=sizes, c=colours, edgecolor='w')
# Make the bubbles a bit transparent: some large ones overlap smaller ones
sct.set_alpha(0.75)
# The countries' GDPs span several orders of magnitude so a log-scale
# is appropriate.
ax.set_xscale('log')

ax.set_xlabel('GDP per capita')
ax.set_ylabel('Body Mass Index of men (kg/m2)')

plt.show()
The figure produced has been styled to resemble those of gapminder.org.