Posted by: christian on 25 Aug 2015
Last blog article about UK house prices (promise). It has become popular in the media to present house prices on a choropleth map, in which regions are coloured according to the price. Using the database created in this previous blog post, we can do this (fairly) easily. Here, the regions considered will be based on the first letters of the properties' postcodes.
First, extract the postcode "stubs" defining these regions. Following the approach of the Python code given in the last blog post, with an open connection using psycopg2, write them to a file postcode-stubs.txt:
query = 'SELECT DISTINCT postcode FROM pp'
postcodes = cursor.fetchall()

postcode_stubs = set([postcode[0][:2] for postcode in cursor.fetchall()])
with open('postcode-stubs.txt', 'w') as fo:
    for postcode_stub in sorted(postcode_stubs):
        print(postcode_stub, file=fo)
Next, read them back in and find the median house price in 2014 for each region, writing the output to postcode_medians.txt.
postcode_stubs = [line.strip() for line in open('postcode-stubs.txt')]
with open('postcode_medians.txt', 'w') as fo:
    for postcode_stub in postcode_stubs:
        query = "SELECT price from pp WHERE date_of_transfer > '2014-01-01'"\
                " AND date_of_transfer < '2015-01-01' AND postcode LIKE"\
                " '{:s}%'".format(postcode_stub)
        cursor.execute(query)
        prices = np.array(cursor.fetchall())
        median_price = np.median(prices)
        print(postcode_stub, median_price, file=fo)
Now we've got the median prices, we need a map of postcode areas. Open Door Logistics provide UK postcode boundary polygons in shapefile format for download here. We're going to use d3.js, so we need a GeoJSON version. I used the GDAL tool ogr2ogr to convert the shapefile Areas.shp to postcode-areas.json:
$ ogr2ogr -f GeoJSON postcode-areas.json Areas.shp
Finally, the excellent d3.js library can be used to render the map in SVG. Following the "Let's make a map" tutorial using postcode-areas.json, the relevant Javascript is:
d3.json("postcode-areas.json", function(error, uk) {
  svg.selectAll("path")
      .data(uk.features)
    .enter().append("path")
      .attr("class", function(d) { return "county " + d.properties.name; })
      .attr("d", path).attr("fill", "#cccccc");
});
Each "county" has been given a class name of the letter(s) corresponding to its postcode "stub", so we need to style path objects with fill-colours corresponding to the house price medians we've calculated above.
The following code generates HTML-style hex codes for colors mapped to the price values from the Matplotlib cm.afmhot_r colormap. There's a small complication, in that the map uses just the initial letters of the postcode whereas the postcode stubs are the first two characters (which are sometimes a letter and a number, as in W8. We choose to simply take the mean of such postcode stubs for the map.
prices = {}
for line in open('postcode_medians.txt'):
    try:
        stub, p = line.split()
        p = float(p)
    except ValueError:
        continue
    if p != p:
        # ie nan
        continue
    if stub[1].isdigit():
        stub = stub[0]
    if stub in prices.keys():
        prices[stub].append(p)
    else:
        prices[stub] = [p]

p_min = 50000
p_max = 500000

for stub, price in prices.items():
    price = sum(price)/len(price)
    i = int((price-p_min)/(p_max-p_min) * 255)
    rgb = (np.round(np.array(cm.afmhot_r(i)[:3]) * 255)).astype(int)
    print('.'+stub, '{ fill: #'+''.join(['{:02X}'.format(c) for c in rgb]) + ';}')
With this CSS, here's the map:
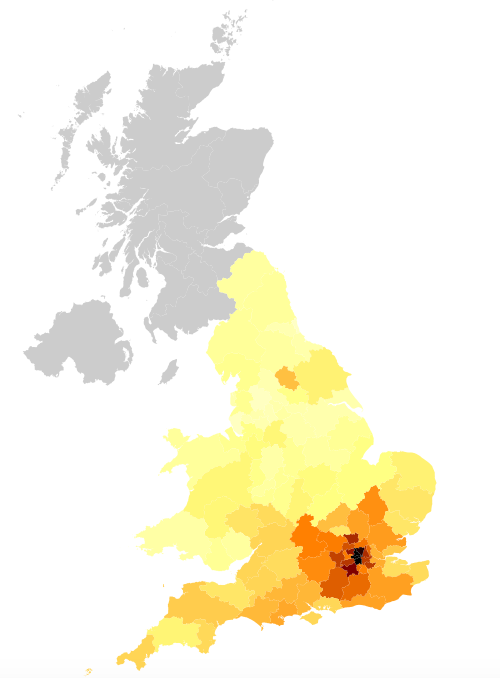
(The Land Registry database I chose does not include data on Scotland, so postcodes there are coloured grey.)
Share on Twitter Share on Facebook
Comments
Comments are pre-moderated. Please be patient and your comment will appear soon.
Christopher Turnbull 3 years ago
Nice tutorial Christian.
Link | ReplyHaving a bit of trouble with the d3, I've entered:
</head>
<body>
<script type="text/javascript">
d3.json("postcode-areas.json", function(error, uk) {
svg.selectAll("path")
.data(uk.features)
.enter().append("path")
.attr("class", function(d) { return "county " + d.properties.name; })
.attr("d", path).attr("fill", "#cccccc");
});
</script>
</body>
but my editor is complaining that uk.features and d.properties are unknown variables. Are there any steps missing - and any chance you could show the final .HTML file?
christian 3 years ago
Hmm – it looks like this code is no longer compatible with the latest versions of d3.js – I might have to update it when I get time. You could try looking here: https://medium.com/@mbostock/command-line-cartography-part-1-897aa8f8ca2c for Mike Bostock's tutorial on making thematic maps.
Link | ReplyNew Comment