Posted by: christian on 3 Dec 2015
Using the database of the UK land registry's record of house sales, we can extract the total number of sales for each day as follows:
import psycopg2
conn = psycopg2.connect(database='house_prices',
                    user='<USERNAME>', password='<PASSWORD>')

cursor = conn.cursor()

query = ("SELECT date_of_transfer, SUM(1) FROM pp"
         " GROUP BY 1 ORDER BY 1;")

cursor.execute(query)

with open('sales_by_day.txt', 'w') as fo:
    for row in cursor.fetchall():
        print(*row, file=fo)
The PostGreSQL statement here sums and orders the sales according to their dates of transfer.
The file sales_by_day.txt now looks like:
$ head sales_by_day.txt
1995-01-01 56
1995-01-02 65
1995-01-03 981
1995-01-04 1098
1995-01-05 1292
1995-01-06 5054
1995-01-07 30
1995-01-08 74
1995-01-09 1279
1995-01-10 952
We can use Pandas to analyse these data in different ways. For example, to determine the total number of house sales by day of the month:
import numpy as np
import pandas as pd
import matplotlib.pyplot as plt
# Read in the number of house sales each day
df = pd.read_table('sales_by_day.txt', sep=' ',
names=('date_of_transfer', 'nsales'), parse_dates=[0])
# Aggregate and sum by day of month
df['day'] = df.set_index('date_of_transfer').index.day
nsales_by_day = df.groupby('day').sum()
fig = plt.figure()
ax = fig.add_subplot(111)
bars = ax.bar(np.arange(31)+1, nsales_by_day['nsales']/1000,
align='center', color='#cc88cc')
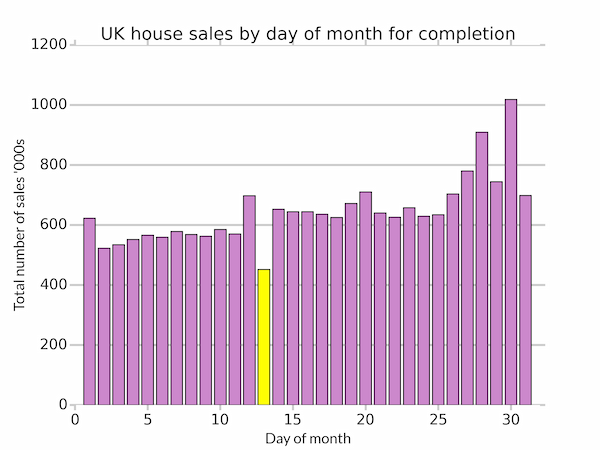
# Highlight the 13th in yellow
bars[12].set_facecolor('#ffff00')
ax.set_xlabel('Day of month')
ax.set_ylabel('Total number of sales \'000s')
ax.set_xlim(0,32)
ax.tick_params(length=5, width=2, direction='out',color='#cccccc')
ax.yaxis.grid(color='#cccccc', linestyle='-', lw=2)
for pos in ax.spines:
ax.spines[pos].set_visible(False)
ax.set_title('UK house sales by day of month for completion')
ax.set_axisbelow(True)
plt.show()
By default, the Pandas read_table function identifies fields as separated by tabs so we need to pass sep=' ' explicitly. We also need to tell Python to treat the first column as a date (parse_dates=[0]).
We can extract the day number and add it as an extra column with
df['day'] = df.set_index('date_of_transfer').index.day
And then take the sum of the sales, grouped by day number with
nsales_by_day = df.groupby('day').sum()
The plotted data show a significant minimum on the 13th. Presumably house-buyers are superstitious.
Comments
Comments are pre-moderated. Please be patient and your comment will appear soon.
There are currently no comments
New Comment