Learning Scientific Programming with Python (2nd edition)
E9.8: Writing a pandas DataFrame to an Excel file
To create some data to write to a file, the following program generates a DataFrame with the height of a projectile launched at three different angles (in the columns) as a function of time (rows):
import numpy as np
import pandas as pd
import matplotlib.pyplot as plt

# Acceleration due to gravity, m.s-2.
g = 9.81

# Time grid, s.
t = np.linspace(0, 5, 500)
# Projectile launch angles, deg.
theta0 = np.array([30, 45, 80])
# Projectile launch speen, m.s-1.
v0 = 20


def z(t, v0, theta0):
    """Return the height of the projectile at time t > 0."""
    return -g / 2 * t**2 + v0 * t * np.sin(theta0)


def x(t, v0, theta0):
    """Return the range of the projectile at time t > 0."""
    return v0 * t * np.cos(theta0)


# An empty DataFrame with columns for the different launch angles.
df = pd.DataFrame(columns=theta0, index=t)
# Populate df with the projectile heights as a function of time.
for theta in theta0:
    df[theta] = z(t, v0, np.radians(theta))
# Once the projectile has landed (z <= 0), set the height data as invalid.
df[df <= 0] = np.nan

# Create a Matplotlib figure with the trajectories plotted.
fig, ax = plt.subplots()
for theta in theta0:
    ax.plot(x(t, v0, np.radians(theta)), df[theta], label=rf"${theta}^\circ$")

# The maximum height obtained by the projectile for each value of theta0.
heights = df.max()
print(heights)
# Set the y-limits with a bit of padding at the top; label the axes.
ax.set_ylim(0, heights.max() * 1.05)
ax.set_xlabel("Range /m")
ax.set_ylabel("Height /m")
ax.legend()
plt.show()
The plot of the trajectories that is produced by this code is reproduced below.
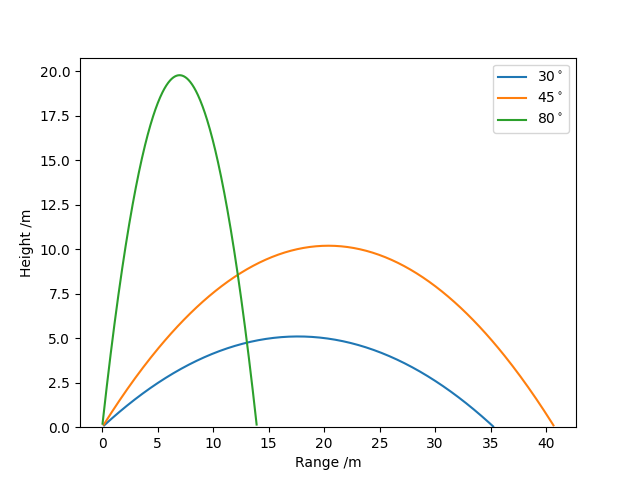
Trajectories of a projectile launched with v0 = 20 m.s−1 at three different angles.
To save the DataFrame df to an Excel file in a single sheet, use to_excel:
df.to_excel('projectile.xlsx', sheet_name='Dependence on angle', )
To write an Excel file with more than one sheet, create a pd.ExcelWriter object and call to_excel for each pandas object to output:
with pd.ExcelWriter('projectile2.xlsx') as writer:
    for theta in theta0:
        # Only retain the valid data for each trajectory.
        ser = df[theta].dropna()
        # Change the Series index to be the range instead of time.
        ser.index = x(ser.index, v0, np.radians(theta))
        ser.to_excel(writer, sheet_name=f'{theta} deg')