Learning Scientific Programming with Python (2nd edition)
E9.10: Resampling a DataFrame to plot statistics of a river gauge
The file river-level.csv lists the height in meters above sea level of Chitterne Brook, a small river in Wiltshire, England. Heights are given as minimum, average, and maximum values for each day between 1 January 2014 and 31 December 2016.
The following code reads in the data and plots the daily river height along with its monthly average, minimum and maximum values.
import pandas as pd
import matplotlib.pyplot as plt

df = pd.read_csv(
    "river-level.csv", index_col=0, comment="#", parse_dates=True
)

rs_monthly = df.resample("ME")

df["avg_level"].plot(label="Daily average")
rs_monthly["avg_level"].mean().plot(label="Monthly average")
rs_monthly["min_level"].min().plot(label="Monthly minimum")
rs_monthly["max_level"].max().plot(label="Monthly maximum")

plt.xlabel("Date")
plt.ylabel("River level /m")
plt.gca().legend()
plt.show()
Note that we need to set parse_dates=True to force pandas to interpret the first column as a DatetimeIndex. Also, since the publication of the second edition of the book, the resampling code "M" has been replaced by the more explicit "ME" for "month-end".
The resulting plot is shown below.
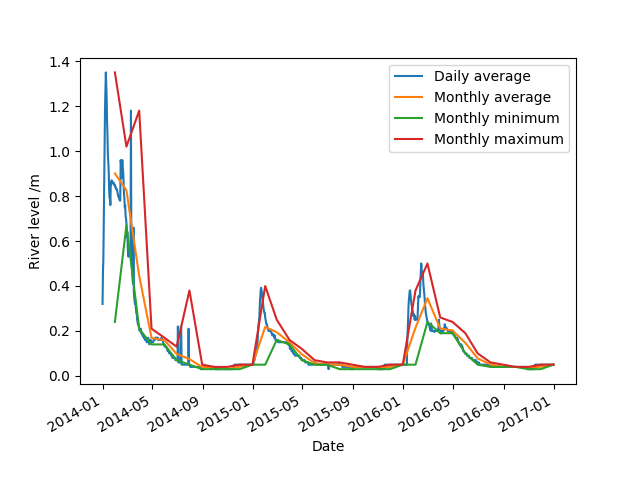
The level of Chitterne Brook in meters over the period 2014–2016.