Learning Scientific Programming with Python (2nd edition)
E7.18: Some colourful shapes
This code produces an image of some colourful shapes.
import numpy as np
import matplotlib.pyplot as plt
from matplotlib.patches import Polygon, Circle, Rectangle

red, blue, yellow, green = "#ff0000", "#0000ff", "#ffff00", "#00ff00"
square = Rectangle((0.7, 0.1), 0.25, 0.25, facecolor=red)
circle = Circle((0.8, 0.8), 0.15, facecolor=blue)
triangle = Polygon(((0.05, 0.1), (0.396, 0.1), (0.223, 0.38)), fc=yellow)
rhombus = Polygon(
    ((0.5, 0.2), (0.7, 0.525), (0.5, 0.85), (0.3, 0.525)), fc=green
)

fig, ax = plt.subplots()
ax.set_facecolor("k")
ax.set_aspect("equal")
for shape in (square, circle, triangle, rhombus):
    ax.add_artist(shape)
ax.xaxis.set_visible(False)
ax.yaxis.set_visible(False)

plt.show()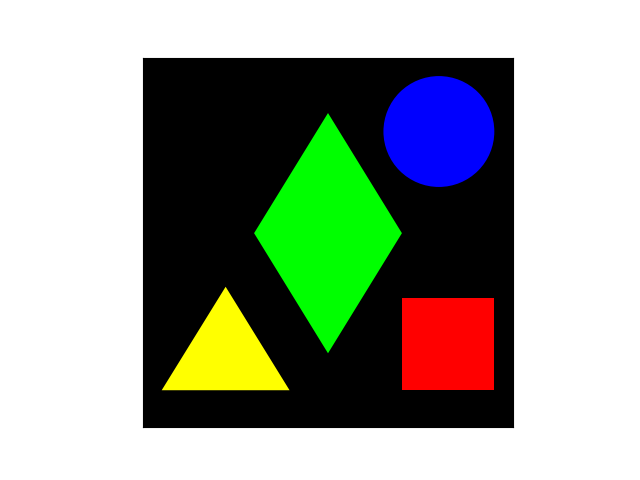
Some colourful shapes.