Learning Scientific Programming with Python (2nd edition)
E7.10: Renewable energy in Germany
The file germany-energy-sources.txt contains data on the renewable sources of electricity produced in Germany from 1990 to 2018:
Renewable electricity generation in Germany in GWh (million kWh)
Year      Hydro    Wind      Biomass  Photovoltaics
2013     21200     49800      47800     29300
2012     21793     50670      43350     26380
2011     17671     48883      37603     19559
...
The program below plots these data as a stacked bar chart, using Matplotlib's hatch patterns to distinguish between the different sources.
To include a legend, each bar chart object must be stored in a list, bars, which is passed to the ax.legend method with a corresponding sequence of labels, sources.
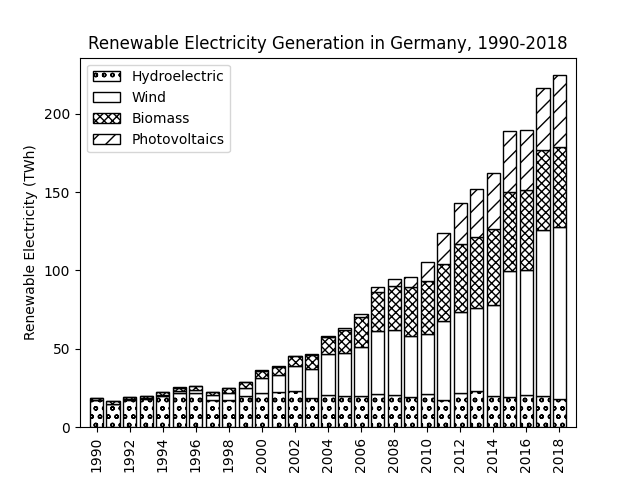
Renewable Electricity Generation in Germany, 1990-2018.