Learning Scientific Programming with Python (2nd edition)
E7.3: Population changes in five US cities
The historical populations of five US cities are given in the files boston.tsv, houston.tsv, detroit.tsv, san_jose.tsv, phoenix.tsv as tab-separated columns of (year, population). They can be downloaded as us-city-populations.zip.
The following program plots these data on one set of axes with a different line style for each.
import matplotlib.pyplot as plt
import numpy as np

fig, ax = plt.subplots()

cities = ["Boston", "Houston", "Detroit", "San Jose", "Phoenix"]
# line styles: solid, dashes, dots, dash-dots, and dot-dot-dash
linestyles = [
    {"ls": "-"},
    {"ls": "--"},
    {"ls": ":"},
    {"ls": "-."},
    {"dashes": [2, 4, 2, 4, 8, 4]},
]

for i, city in enumerate(cities):
    filestem = city.lower().replace(" ", "_")
    filename = f"{filestem}.tsv"
    yr, pop = np.loadtxt(filename, unpack=True)
    (line,) = ax.plot(yr, pop / 1.0e6, label=city, color="k", **linestyles[i])
ax.legend(loc="upper left")
ax.set_xlim(1800, 2020)
ax.set_xlabel("Year")
ax.set_ylabel("Population (millions)")
plt.show()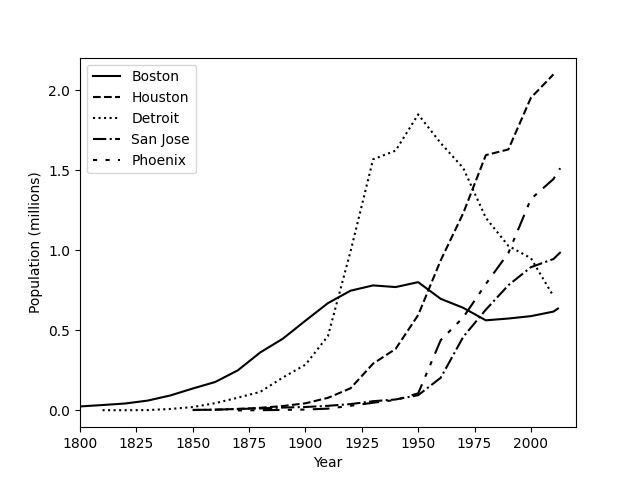
A plot of the historical populations of five US cities.