Learning Scientific Programming with Python (2nd edition)
E7.8: Ganged subplots
This code generates a figure of 10 subplots depicting the graph of $\sin(n\pi x)$ for $n=0,1,\cdots, 9$. The subplot spacing is configured so that they "run into" each other vertically.
import numpy as np
import matplotlib.pyplot as plt

nrows = 10
fig, axes = plt.subplots(nrows, 1)
# Zero vertical space between subplots
fig.subplots_adjust(hspace=0)

x = np.linspace(0, 1, 1000)
for i in range(nrows):
    # n=nrows for the top subplot, n=0 for the bottom subplot
    n = nrows - i
    axes[i].plot(x, np.sin(n * np.pi * x), "k", lw=2)
    # We only want ticks on the bottom of each subplot
    axes[i].xaxis.set_ticks_position("bottom")
    if i < nrows - 1:
        # Set ticks at the nodes (zeros) of our sine functions
        axes[i].set_xticks(np.arange(0, 1, 1 / n))
        # We only want labels on the bottom subplot xaxis
        axes[i].set_xticklabels("")
    axes[i].set_yticklabels("")
    axes[i].set_xlim(0, 1)
plt.show()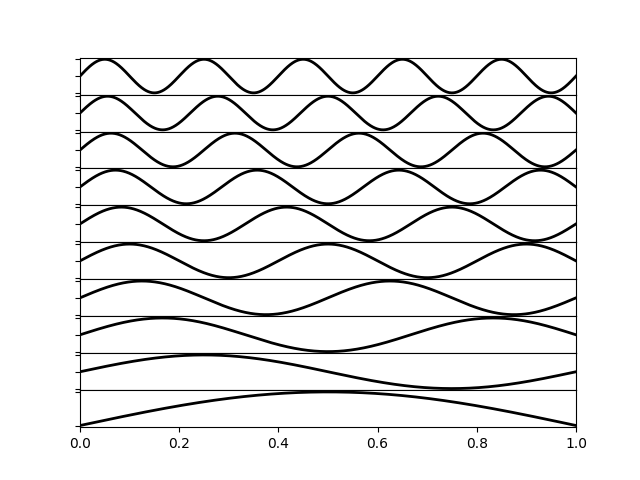
Ganged subplots.