Learning Scientific Programming with Python (2nd edition)
E7.13: Arrow styles
The following program produces a plot with eight arrows with different styles.
import numpy as np
import matplotlib.pyplot as plt

fig, ax = plt.subplots()
x = np.linspace(0, 1)
ax.plot(x, x, "o")

ax.annotate(
    "default line",
    xy=(0.15, 0.1),
    xytext=(0.6, 0.1),
    arrowprops={"arrowstyle": "-"},
    va="center",
)
ax.annotate(
    "dashed line",
    xy=(0.25, 0.2),
    xytext=(0.6, 0.2),
    arrowprops={"arrowstyle": "-", "ls": "dashed"},
    va="center",
)
ax.annotate(
    "default arrow",
    xy=(0.35, 0.3),
    xytext=(0.6, 0.3),
    arrowprops={"arrowstyle": "->"},
    va="center",
)
ax.annotate(
    "thick blue arrow",
    xy=(0.45, 0.4),
    xytext=(0.6, 0.4),
    arrowprops={"arrowstyle": "->", "lw": 4, "color": "blue"},
    va="center",
)
ax.annotate(
    "double-headed arrow",
    xy=(0.45, 0.5),
    xytext=(0.01, 0.5),
    arrowprops={"arrowstyle": "<->"},
    va="center",
)
ax.annotate(
    "arrow with closed head",
    xy=(0.55, 0.6),
    xytext=(0.1, 0.6),
    arrowprops={"arrowstyle": "-|>"},
    va="center",
)
ax.annotate(
    "a really thick red arrow\nwith not much space",
    xy=(0.65, 0.7),
    xytext=(0.1, 0.7),
    va="center",
    multialignment="right",
    arrowprops={"arrowstyle": "-|>", "lw": 8, "ec": "r"},
)
ax.annotate(
    "a really thick red arrow\nwith space between\nthe tail and thelabel",
    xy=(0.85, 0.9),
    xytext=(0.1, 0.9),
    va="center",
    multialignment="right",
    arrowprops={"arrowstyle": "-|>", "lw": 8, "ec": "r", "shrinkA": 10},
)
plt.show()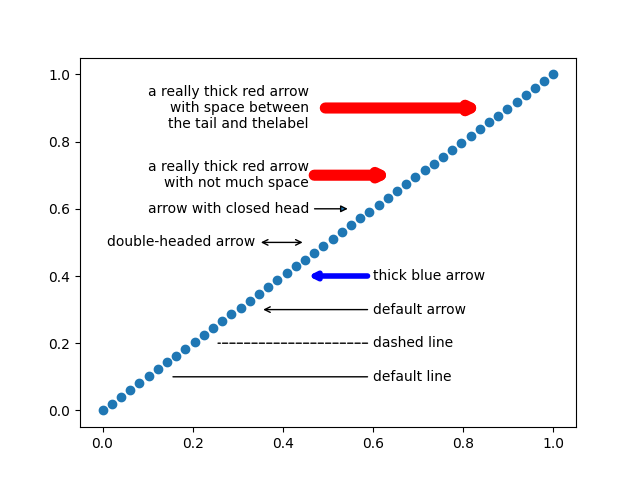
An illustration of different Matplotlib arrow styles.