Learning Scientific Programming with Python (2nd edition)
E7.29: Animating a decaying sine curve 2: blitting
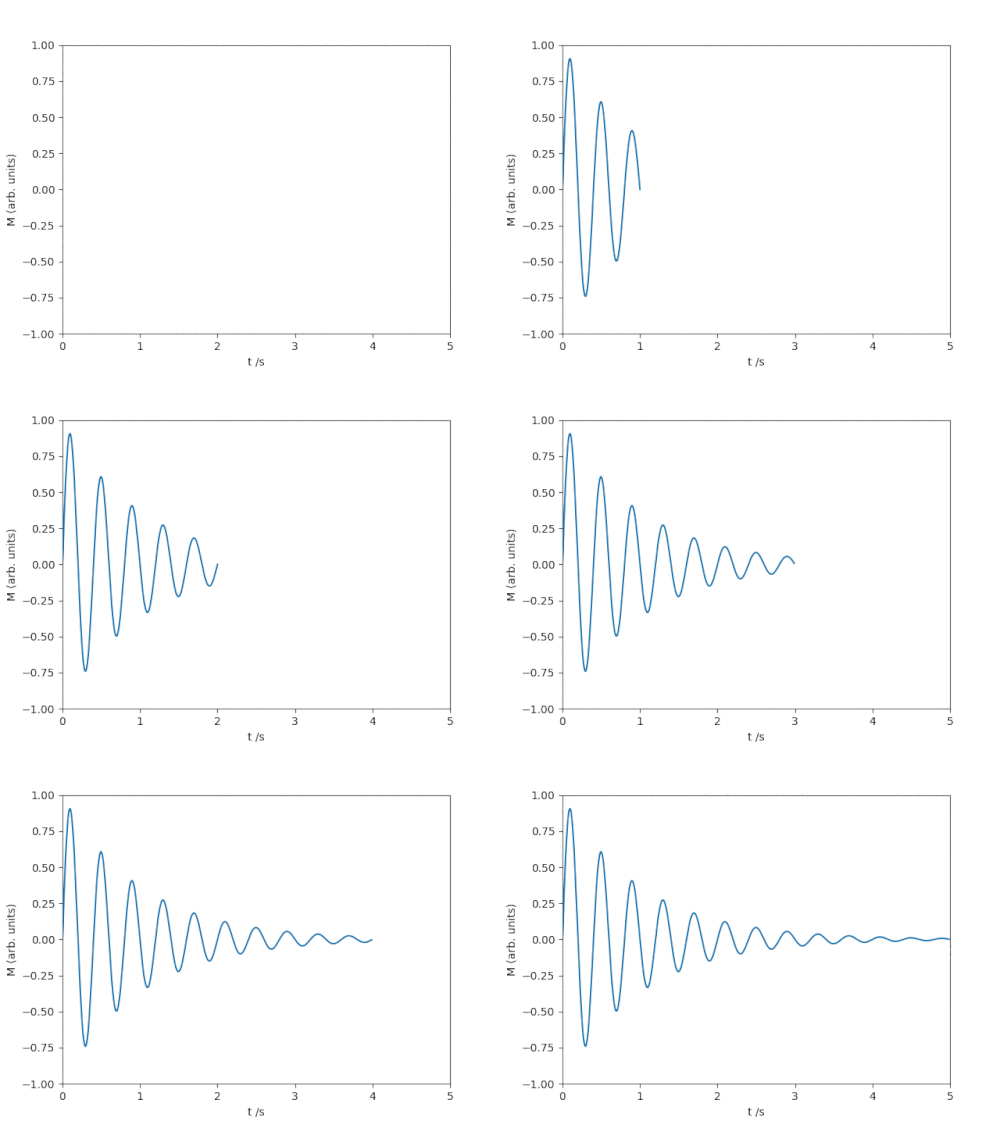
This code repeats the animation of the previous example, but using the blitting technique and passing arguments explicitly to the animation function instead of declaring them to be globals within it.
import numpy as np
import matplotlib.pyplot as plt
import matplotlib.animation as animation

# Time step for the animation (s), max time to animate for (s).
dt, tmax = 0.01, 5
# Signal frequency (s-1), decay constant (s-1).
f, alpha = 2.5, 1
# These lists will hold the data to plot.
t, M = [], []

# Draw an empty plot, but preset the plot x- and y-limits.
fig, ax = plt.subplots()
(line,) = ax.plot([], [])
ax.set_xlim(0, tmax)
ax.set_ylim(-1, 1)
ax.set_xlabel("t /s")
ax.set_ylabel("M (arb. units)")


def init():
    return (line,)


def animate(i, t, M):
    """Draw the frame i of the animation."""

    # Append this time point and its data and set the plotted line data.
    _t = i * dt
    t.append(_t)
    M.append(np.sin(2 * np.pi * f * _t) * np.exp(-alpha * _t))
    line.set_data(t, M)
    return (line,)


# Interval between frames in ms, total number of frames to use.
interval, nframes = 1000 * dt, int(tmax / dt)
# Animate once (set repeat=False so the animation doesn't loop).
ani = animation.FuncAnimation(
    fig,
    animate,
    frames=nframes,
    init_func=init,
    fargs=(t, M),
    repeat=False,
    interval=interval,
    blit=True,
)
plt.show()Note: Any objects assigned to the fargs argument of FuncAnimation will be handed on to the animation function.

Matplotlib animation of a ringdown process (with blitting).