Learning Scientific Programming with Python (2nd edition)
E6.10: The correlation between air pressure and temperature
The Cambridge University Digital Technology Group have been recording the weather from the roof of their department building since 1995 and make the data available to download in a single CSV file.
The following program determines the correlation coefficient between pressure and temperature at this site.
import numpy as np
import matplotlib.pyplot as plt


data = np.genfromtxt("weather-raw.csv", delimiter=",", usecols=(1, 4))
# Remove any rows with either missing T or missing p.
data = data[~np.any(np.isnan(data), axis=1)]

# Temperatures are reported after multiplication by a factor of 10 so remove
# this factor.
data[:, 0] /= 10
# Remove temperature outliers (degC).
data = data[(data[:, 0] > -20) & (data[:, 0] < 40)]
# Remove pressure outliers (mbar).
data = data[(data[:, 1] > 920) & (data[:, 1] < 1100)]

# Get the correlation coefficient
corr = np.corrcoef(data, rowvar=0)[0, 1]
print(f"p-T correlation coefficient: {corr:.4f}")

# Plot the data on a scatter plot: T on x-axis, p on y-axis.
plt.scatter(*data.T, marker=".", s=2)
plt.xlabel(r"$T$ /$\mathrm{^\circ C}$")
plt.ylabel(r"$p$ /mbar")
plt.show()
The output gives a correlation coefficient of 0.0322: as expected, there is little correlation between air temperature and pressure (since the air density also varies).
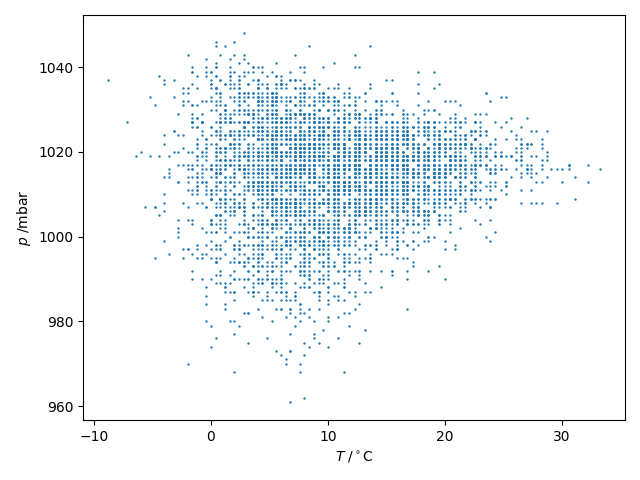
The correlation between air pressure and temperature