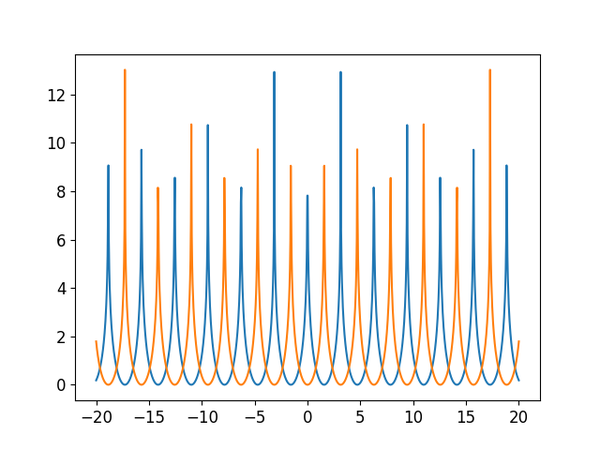
If you run the code below the output should be something like the graph shown here.
import numpy as np
import matplotlib.pyplot as plt

x = np.linspace(-20, 20, 1000)
def f1(x):
    return np.log(np.sin(x)**-2)
def f2(x):
    return np.log(np.cos(x)**-2)

plt.plot(x, f1(x))
plt.plot(x, f2(x))
plt.show()
Consider $f_1(x)$. This function is infinite for $x = n\pi$ where $n = 0, 1, 2, \cdots$ as Python will tell you:
>>> f1(0)
__main__:2: RuntimeWarning: divide by zero encountered in double_scalars
inf
However, the discrete grid of $x$ values we have chosen does not actually include any of these points, and so the peaks appear as maxima which vary in height according to how close to $x = n\pi$ the points in x become. For example, in the vicinity of $x=0$:
>>> x[498:502]
array([-0.06006006, -0.02002002,  0.02002002,  0.06006006])
>>> f1(x[498:502])
array([ 5.62602298,  7.82217861,  7.82217861,  5.62602298])
but near $x = \pi$,
>>> x[576:580]
array([ 3.06306306,  3.1031031 ,  3.14314314,  3.18318318])
>>> f1(x[576:580])
array([  5.09061561,   6.51523082,  12.93836992,   6.36034221])