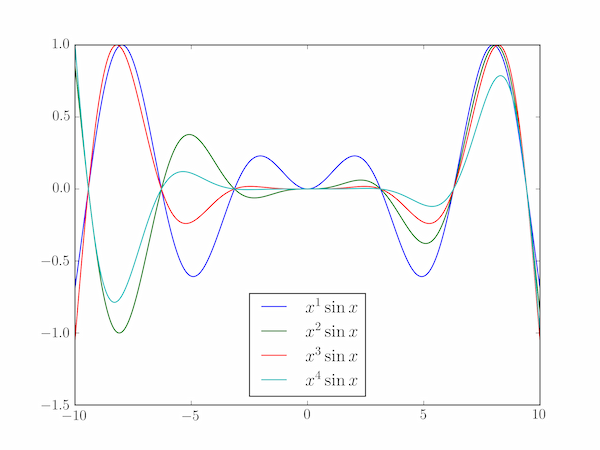
To plot the functions $f_n(x) = x^n\sin x$ for $n=1,2,3,4$:
import numpy as np
import matplotlib.pyplot as plt
plt.rc('text', usetex=True)

x = np.linspace(-10,10,1001)
for n in range(1,5):
    y = x**n * np.sin(x)
    y /= max(y)
    plt.plot(x,y, label=r'$x^{}\sin x$'.format(n))
plt.legend(loc='lower center')
plt.show()
To make the graphs easier to compare, they have been scaled to a maximum of 1 in the region considered.