Learning Scientific Programming with Python (2nd edition)
E7.6: Fledging bird weights
Before fledging, some species of birds lose weight relative to the surface area of their wings to maximise their aerodynamic efficiency. The file fledging-data.csv gives wing-loading values (body mass per wing area) as averages for two broods of swifts in the two weeks prior to fledging, with their uncertainties (J. Wright et al., Proc. R. Soc. B 273, 1895 (2006).)
In the program below, we perform a weighted fit to the data and plot it, with error bars.
import numpy as np
import matplotlib.pyplot as plt

# Read in the data: day before fledging, wing loading and error for two broods.
dt = np.dtype(
    [
        ("day", "i2"),
        ("wl1", "f8"),
        ("wl1-err", "f8"),
        ("wl2", "f8"),
        ("wl2-err", "f8"),
    ]
)
data = np.loadtxt("fledging-data.csv", dtype=dt, delimiter=",")

# Weighted fit of exponential decay to the data. This is a linear least-squares
# problem because y = Aexp(-Bx) => ln y = ln A - Bx = mx + c.
p1_fit = np.poly1d(
    np.polyfit(
        data["day"], np.log(data["wl1"]), 1, w=np.log(data["wl1"]) ** -2
    )
)
p2_fit = np.poly1d(
    np.polyfit(
        data["day"], np.log(data["wl2"]), 1, w=np.log(data["wl2"]) ** -2
    )
)
wl1fit = np.exp(p1_fit(data["day"]))
wl2fit = np.exp(p2_fit(data["day"]))

# Plot the data points with their uncertainties and the fits.
fig, ax = plt.subplots()

# wl1 data: white circles, black borders, with error bars.
ax.errorbar(
    data["day"],
    data["wl1"],
    yerr=data["wl1-err"],
    ls="",
    marker="o",
    color="k",
    mfc="w",
    mec="k",
    capsize=3,
)
ax.plot(data["day"], wl1fit, "k", lw=1.5)

# wl2 data: black filled circles, with error bars.
ax.errorbar(
    data["day"],
    data["wl2"],
    yerr=data["wl2-err"],
    ls="",
    marker="o",
    color="k",
    mfc="k",
    mec="k",
    capsize=3,
)
ax.plot(data["day"], wl2fit, "k", lw=1.5)

ax.set_xlim(15, 0)
ax.set_ylim(0.003, 0.012)
ax.set_xlabel("Days pre-fledging")
ax.set_ylabel(r"Wing loading ($\mathrm{g\,mm^{-2}}$)")
plt.show()
The data points are weighted in the fit by $1/\sigma^2$ where $\sigma$ is the estimated one-standard deviation error of the measurement.
The figure below shows the results of the fit. The broods, initially with different average wing loading values, are seen to converge prior to fledging.
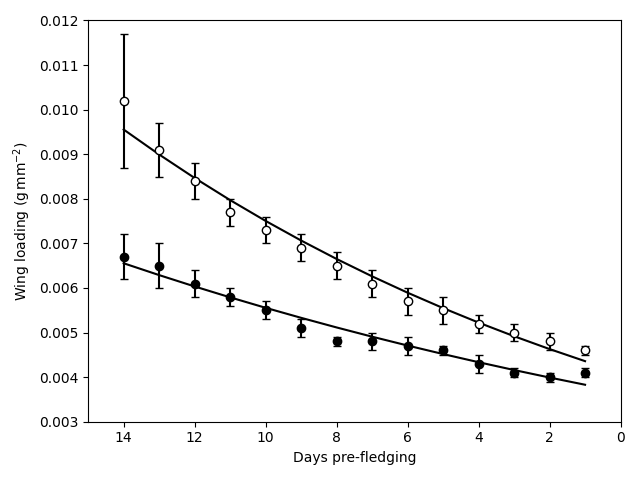
Fledging bird wing-loading fit for two broods of swifts in the two weeks prior to fledging.