Visualizing Kaczmarz's Algorithm
Posted on 18 March 2022
Kaczmarz's algorithm is an iterative algorithm for solving a system of linear equations. In its simplest form, the equations are written in matrix form, $\boldsymbol{A}\boldsymbol{x} = \boldsymbol{b}$ and, starting with the initial guess for the solution, $\boldsymbol{x}_1 = \boldsymbol{0}$, the zero vector, successive approximations are generated by projecting $\boldsymbol{x}_k$ onto the hyperplanes defined by the rows of $\boldsymbol{A}$: $\boldsymbol{a}_1, \boldsymbol{a}_2, \ldots$. $$ \boldsymbol{x}_{k+1} = \boldsymbol{x}_{k} + \frac{b_{i} - \boldsymbol{a}_i.\boldsymbol{x}_k}{|\boldsymbol{a}_i|^2} \boldsymbol{a}_i $$
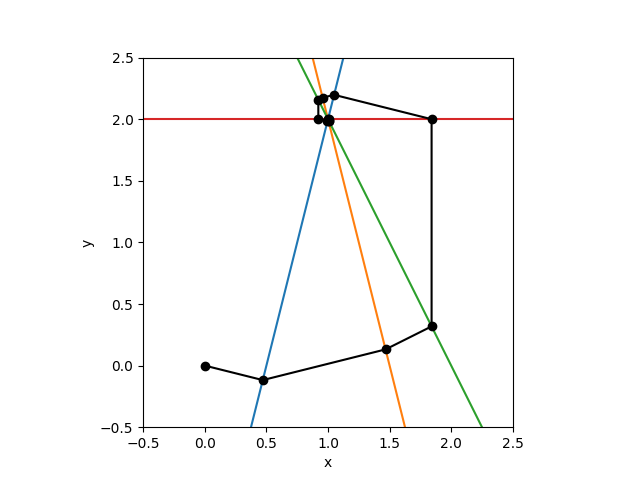
For the purposes of visualization, consider the over-determined problem for which $\boldsymbol{x}$ has two components: in this case, the hyperplanes are straight lines, and the projection can be depicted on a two-dimensional chart, as produced by the code below. The system taken is
$$ \begin{pmatrix} -4 & 1 \\ 2 & \frac{1}{2}\\ 3 & \frac{3}{2}\\ 0 & 1 \end{pmatrix} \boldsymbol{x} = \begin{pmatrix} -2\\ 3\\ 6\\ 2 \end{pmatrix} $$
and the solution is the point at which the lines defined by these equations (taking $\boldsymbol{x} = (x\;\; y)^T$) intersect.
In a modified version of this algorithm, which sometimes leads to faster convergence, instead of cycling through the rows of $\boldsymbol{A}$, one randomly chooses a row with a probability proportional to $|\boldsymbol{a}_i|^2$:

import numpy as np
import matplotlib.pyplot as plt

# The linear equation system to solve: AX = b.
A = np.array([[-4, 1], [2, 0.5], [3, 1.5], [0, 1]])
b = np.array([-2, 3, 6, 2.])
m, n = A.shape

def solve_kaczmarz(A, b, TOL=1.e-6, randomize=False):
    def calc_err(X):
        return np.max(np.abs(A @ X - b))

    X = np.zeros(n)
    Xhistory = [X]
    err_history = [calc_err(X)]
    k = 0
    if randomize:
        p = (np.linalg.norm(A, axis=1) / np.linalg.norm(A))**2
    else:
        p = range(m)
    print(p)
    while True:
        if randomize:
            i = np.random.choice(range(m), p=p)
        else:
            i = k % m
        ai = A[i,:]
        Xnew = X + (b[i] - ai @ X) / np.linalg.norm(ai)**2 * ai
        err = np.max(np.abs(A @ Xnew - b))
        Xhistory.append(Xnew)
        err_history.append(err)
        if err < TOL:
            break
        X = Xnew
        k += 1
    return X, np.array(Xhistory), np.array(err_history)

def plot_trajectory(Xhistory):
    # Draw the problem array hyperplanes, which for n = 2 are lines.
    x = np.linspace(-5, 5, 2)
    M = np.vstack((x, np.ones(2))).T
    for i in range(m):
        y = M @ (-A[i,0], b[i]) / A[i,1]
        plt.plot(x, y)

    # Plot the trajectory of the Kaczmarz solution algorithm.
    plt.plot(Xhistory[:,0], Xhistory[:,1], 'k-o')
    # Set the Axes aspect ratio so that right angles look correct.
    plt.axis('square')
    plt.xlim(-0.5, 2.5)
    plt.ylim(-0.5, 2.5)
    plt.xlabel('x')
    plt.ylabel('y')
    plt.show()

X, Xhistory, _ = solve_kaczmarz(A, b, 1.e-2, randomize=False)
plot_trajectory(Xhistory)
X, Xhistory, _ = solve_kaczmarz(A, b, 1.e-2, randomize=True)
plot_trajectory(Xhistory)
print(f'Solution vector: {X}.')